HSBC 2006 Annual Report Download - page 137
Download and view the complete annual report
Please find page 137 of the 2006 HSBC annual report below. You can navigate through the pages in the report by either clicking on the pages listed below, or by using the keyword search tool below to find specific information within the annual report.-
 1
1 -
2
-
3
-
4
-
5
-
6
-
7
-
8
-
9
-
10
-
11
-
12
-
13
-
14
-
15
-
16
-
17
-
18
-
19
-
20
-
21
-
22
-
23
-
24
-
25
-
26
-
27
-
28
-
29
-
30
-
31
-
32
-
33
-
34
-
35
-
36
-
37
-
38
-
39
-
40
-
41
-
42
-
43
-
44
-
45
-
46
-
47
-
48
-
49
-
50
-
51
-
52
-
53
-
54
-
55
-
56
-
57
-
58
-
59
-
60
-
61
-
62
-
63
-
64
-
65
-
66
-
67
-
68
-
69
-
70
-
71
-
72
-
73
-
74
-
75
-
76
-
77
-
78
-
79
-
80
-
81
-
82
-
83
-
84
-
85
-
86
-
87
-
88
-
89
-
90
-
91
-
92
-
93
-
94
-
95
-
96
-
97
-
98
-
99
-
100
-
101
-
102
-
103
-
104
-
105
-
106
-
107
-
108
-
109
-
110
-
111
-
112
-
113
-
114
-
115
-
116
-
117
-
118
-
119
-
120
-
121
-
122
-
123
-
124
-
125
-
126
-
 127
127 -
 128
128 -
 129
129 -
 130
130 -
 131
131 -
 132
132 -
 133
133 -
 134
134 -
 135
135 -
 136
136 -
 137
137 -
 138
138 -
 139
139 -
 140
140 -
 141
141 -
 142
142 -
 143
143 -
 144
144 -
 145
145 -
 146
146 -
 147
147 -
148
-
149
-
150
-
151
-
152
-
153
-
154
-
155
-
156
-
157
-
158
-
159
-
160
-
161
-
162
-
163
-
164
-
165
-
166
-
167
-
168
-
169
-
170
-
171
-
172
-
173
-
174
-
175
-
176
-
177
-
178
-
179
-
180
-
181
-
182
-
183
-
184
-
185
-
186
-
187
-
188
-
189
-
190
-
191
-
192
-
193
-
194
-
195
-
196
-
197
-
198
-
199
-
200
-
201
-
202
-
203
-
204
-
205
-
206
-
207
-
208
-
209
-
210
-
211
-
212
-
213
-
214
-
215
-
216
-
217
-
218
-
219
-
220
-
221
-
222
-
223
-
224
-
225
-
226
-
227
-
228
-
229
-
230
-
231
-
232
-
233
-
234
-
235
-
236
-
237
-
238
-
239
-
240
-
241
-
242
-
243
-
244
-
245
-
246
-
247
-
248
-
249
-
250
-
251
-
252
-
253
-
254
-
255
-
256
-
257
-
258
-
259
-
260
-
261
-
262
-
263
-
264
-
265
-
266
-
267
-
268
-
269
-
270
-
271
-
272
-
273
-
274
-
275
-
276
-
277
-
278
-
279
-
280
-
281
-
282
-
283
-
284
-
285
-
286
-
287
-
288
-
289
-
290
-
291
-
292
-
293
-
294
-
295
-
296
-
297
-
298
-
299
-
300
-
301
-
302
-
303
-
304
-
305
-
306
-
307
-
308
-
309
-
310
-
311
-
312
-
313
-
314
-
315
-
316
-
317
-
318
-
319
-
320
-
321
-
322
-
323
-
324
-
325
-
326
-
327
-
328
-
329
-
330
-
331
-
332
-
333
-
334
-
335
-
336
-
337
-
338
-
339
-
340
-
341
-
342
-
343
-
344
-
345
-
346
-
347
-
348
-
349
-
350
-
351
-
352
-
353
-
354
-
355
-
356
-
357
-
358
-
359
-
360
-
361
-
362
-
363
-
364
-
365
-
366
-
367
-
368
-
369
-
370
-
371
-
372
-
373
-
374
-
375
-
376
-
377
-
378
-
379
-
380
-
381
-
382
-
383
-
384
-
385
-
386
-
387
-
388
-
389
-
390
-
391
-
392
-
393
-
394
-
395
-
396
-
397
-
398
-
399
-
400
-
401
-
402
-
403
-
404
-
405
-
406
-
407
-
408
-
409
-
410
-
411
-
412
-
413
-
414
-
415
-
416
-
417
-
418
-
419
-
420
-
421
-
422
-
423
-
424
-
425
-
426
-
427
-
428
-
429
-
430
-
431
-
432
-
433
-
434
-
435
-
436
-
437
-
438
-
439
-
440
-
441
-
442
-
443
-
444
-
445
-
446
-
447
-
448
-
449
-
450
-
451
-
452
-
453
-
454
-
455
-
456
-
457
-
458
 |
 |

135
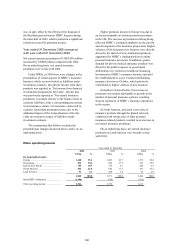
realised on the sale of the Group’s asset management
operations in Australia.
Other operating income in North America rose
by 83 per cent, in part due to improved revenues
from the sale of consumer real estate owned assets,
higher rental income and disposals of property, plant
and equipment.
In Latin America, other operating income
increased by US$240 million, primarily as a result of
the sale of the insurance underwriter HSBC Seguros
de Automoveis e Bens Limitada in Brazil, and the
receipt of compensation and coverage bonds in
Argentina. The receipt of non-core income in
Mexico from the distribution of third-party products
through the HSBC network contributed further to the
increase.
HSBC’s rental income mainly arose from
leasing in the UK. Europe accounted for 80 per cent
of total rental income; the remainder was attributable
to North America and Hong Kong.
The increase in the ‘Other’ caption was largely
driven by the increase in Latin America, reflecting
the receipt of compensation and coverage bonds in
Argentina, increased revenues from ‘capitalisation’
products in Brazil and the receipt of non-core
income in Mexico as noted above.
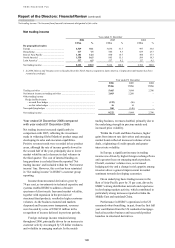
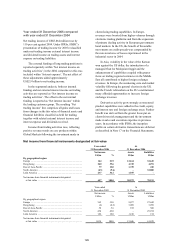
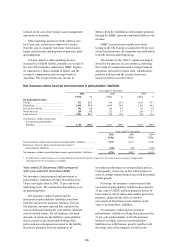
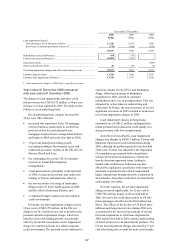
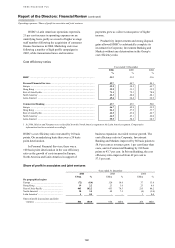
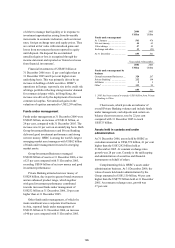
Net insurance claims incurred and movement in policyholders’ liabilities
Year ended 31 December
2006 2005 2004
US$m % US$m % US$m %
By geographical region
Europe ...................................................... 531 11.3 818 20.1 1,628 35.1
Hong Kong .............................................. 2,699 57.4 2,059 50.6 2,154 46.5
Rest of Asia-Pacific ................................. 192 4.1 166 4.1 82 1.8
North America1 ........................................ 259 5.5 232 5.7 236 5.1
Latin America1 ......................................... 1,023 21.7 792 19.5 535 11.5
Net insurance claims incurred and
movement in policyholders’
liabilities .............................................. 4,704
100.0 4,067
100.0 4,635
100.0
Year ended 31 December
2006
US$m
2005
US$m
2004
US$m
Gross insurance claims and movement in policyholders’ liabilities ............... 5,072 4,153 5,220
Reinsurers’ share of claims incurred and movement in
policyholders’ liabilities .............................................................................. (368) (86) (585)
Net insurance claims incurred and movement in policyholders’ liabilities .... 4,704 4,067 4,635
1 In 2006, Mexico and Panama were reclassified from the North America segment to the Latin America segment. Comparative
information has been restated accordingly.
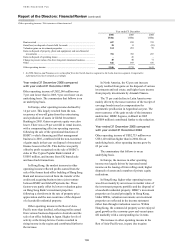
Year ended 31 December 2006 compared
with year ended 31 December 2005
Net insurance claims incurred and movement in
policyholders’ liabilities of US$4,704 million were
16 per cent higher than in 2005, 15 per cent on an
underlying basis. The commentary that follows is on
an underlying basis.
Net insurance claims incurred and the
movement in policyholders’ liabilities arise from
both life and non-life insurance business. For non-
life business, amounts reported here represent the
cost of claims paid during the year and the estimated
cost of notified claims. For life business, the main
elements of claims are the liability to policyholders
that is created on the initial underwriting of the
policy and any subsequent movement in the liability
that arises, primarily from the attribution of
investment performance to savings-related policies.
Consequently, claims rise in line with increases in
sales of savings-related business and with investment
market growth.
In Europe, net insurance claims incurred and
movement in policyholders’ liabilities decreased by
35 per cent to US$531 million, primarily driven by
lower sales of critical illness and creditor protection
products, along with the effect of adverse
movements in fixed interest rate markets on the
value of policyholders’ liabilities.
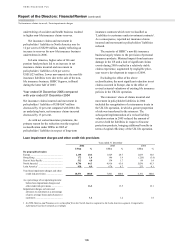
Net insurance claims and movement in
policyholders’ liabilities in Hong Kong increased by
31 per cent, predominantly in the life insurance
business, in which reserves for policyholders’
liabilities rose with business growth, together with
the rising value of investments. Growth in the