HSBC 2006 Annual Report Download - page 68
Download and view the complete annual report
Please find page 68 of the 2006 HSBC annual report below. You can navigate through the pages in the report by either clicking on the pages listed below, or by using the keyword search tool below to find specific information within the annual report.-
 1
1 -
2
-
3
-
4
-
5
-
6
-
7
-
8
-
9
-
10
-
11
-
12
-
13
-
14
-
15
-
16
-
17
-
18
-
19
-
20
-
21
-
22
-
23
-
24
-
25
-
26
-
27
-
28
-
29
-
30
-
31
-
32
-
33
-
34
-
35
-
36
-
37
-
38
-
39
-
40
-
41
-
42
-
43
-
44
-
45
-
46
-
47
-
48
-
49
-
50
-
51
-
52
-
53
-
54
-
55
-
56
-
57
-
 58
58 -
 59
59 -
 60
60 -
 61
61 -
 62
62 -
 63
63 -
 64
64 -
 65
65 -
 66
66 -
 67
67 -
 68
68 -
 69
69 -
 70
70 -
 71
71 -
 72
72 -
 73
73 -
 74
74 -
 75
75 -
 76
76 -
 77
77 -
 78
78 -
79
-
80
-
81
-
82
-
83
-
84
-
85
-
86
-
87
-
88
-
89
-
90
-
91
-
92
-
93
-
94
-
95
-
96
-
97
-
98
-
99
-
100
-
101
-
102
-
103
-
104
-
105
-
106
-
107
-
108
-
109
-
110
-
111
-
112
-
113
-
114
-
115
-
116
-
117
-
118
-
119
-
120
-
121
-
122
-
123
-
124
-
125
-
126
-
127
-
128
-
129
-
130
-
131
-
132
-
133
-
134
-
135
-
136
-
137
-
138
-
139
-
140
-
141
-
142
-
143
-
144
-
145
-
146
-
147
-
148
-
149
-
150
-
151
-
152
-
153
-
154
-
155
-
156
-
157
-
158
-
159
-
160
-
161
-
162
-
163
-
164
-
165
-
166
-
167
-
168
-
169
-
170
-
171
-
172
-
173
-
174
-
175
-
176
-
177
-
178
-
179
-
180
-
181
-
182
-
183
-
184
-
185
-
186
-
187
-
188
-
189
-
190
-
191
-
192
-
193
-
194
-
195
-
196
-
197
-
198
-
199
-
200
-
201
-
202
-
203
-
204
-
205
-
206
-
207
-
208
-
209
-
210
-
211
-
212
-
213
-
214
-
215
-
216
-
217
-
218
-
219
-
220
-
221
-
222
-
223
-
224
-
225
-
226
-
227
-
228
-
229
-
230
-
231
-
232
-
233
-
234
-
235
-
236
-
237
-
238
-
239
-
240
-
241
-
242
-
243
-
244
-
245
-
246
-
247
-
248
-
249
-
250
-
251
-
252
-
253
-
254
-
255
-
256
-
257
-
258
-
259
-
260
-
261
-
262
-
263
-
264
-
265
-
266
-
267
-
268
-
269
-
270
-
271
-
272
-
273
-
274
-
275
-
276
-
277
-
278
-
279
-
280
-
281
-
282
-
283
-
284
-
285
-
286
-
287
-
288
-
289
-
290
-
291
-
292
-
293
-
294
-
295
-
296
-
297
-
298
-
299
-
300
-
301
-
302
-
303
-
304
-
305
-
306
-
307
-
308
-
309
-
310
-
311
-
312
-
313
-
314
-
315
-
316
-
317
-
318
-
319
-
320
-
321
-
322
-
323
-
324
-
325
-
326
-
327
-
328
-
329
-
330
-
331
-
332
-
333
-
334
-
335
-
336
-
337
-
338
-
339
-
340
-
341
-
342
-
343
-
344
-
345
-
346
-
347
-
348
-
349
-
350
-
351
-
352
-
353
-
354
-
355
-
356
-
357
-
358
-
359
-
360
-
361
-
362
-
363
-
364
-
365
-
366
-
367
-
368
-
369
-
370
-
371
-
372
-
373
-
374
-
375
-
376
-
377
-
378
-
379
-
380
-
381
-
382
-
383
-
384
-
385
-
386
-
387
-
388
-
389
-
390
-
391
-
392
-
393
-
394
-
395
-
396
-
397
-
398
-
399
-
400
-
401
-
402
-
403
-
404
-
405
-
406
-
407
-
408
-
409
-
410
-
411
-
412
-
413
-
414
-
415
-
416
-
417
-
418
-
419
-
420
-
421
-
422
-
423
-
424
-
425
-
426
-
427
-
428
-
429
-
430
-
431
-
432
-
433
-
434
-
435
-
436
-
437
-
438
-
439
-
440
-
441
-
442
-
443
-
444
-
445
-
446
-
447
-
448
-
449
-
450
-
451
-
452
-
453
-
454
-
455
-
456
-
457
-
458
 |
 |

HSBC HOLDINGS PLC
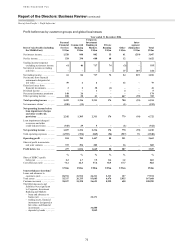
Report of the Directors: Business Review (continued)
Rest of Asia-Pacific > 2006 / 2005
66
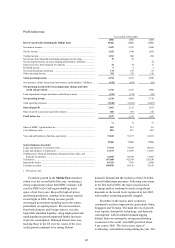
together with the non-recurrence of losses on the
disposal of US dollar securities in Japan in January
2005.
The net recovery in loan impairment charges
declined significantly due to the non-recurrence of a
large recovery in Malaysia in 2005.
Operating expenses increased by 18 per cent to
US$869 million, in part due to an increase in
performance-related incentives which reflected the
robust growth in operating income. In the Middle
East and India, higher staff costs also arose from
additional recruitment to support the expansion of
capabilities across various businesses.
In Global Markets, support costs increased in
line with higher transaction volumes and greater
product complexity, while a rise in payments and
cash management activity, primarily in HSBC’s
operations in India, mainland China, Singapore,
South Korea and Indonesia, resulted in higher
operational expense.
The share of profits in associates increased by
47 per cent, primarily reflecting higher contributions
from HSBC’s investments in Bank of
Communications in mainland China and The
Saudi British Bank.
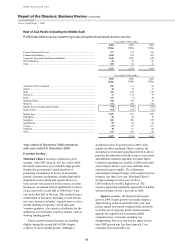
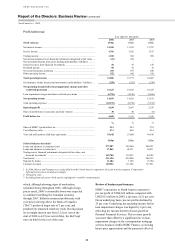
Private Banking reported a pre-tax profit of
US$80 million, a modest increase compared with
2005. Revenue growth was strong across the region
despite challenging market conditions, particularly in
Singapore, with notable contributions from the
onshore Private Banking operations launched in the
Middle East and India during 2005. Employee
benefits rose at a faster rate than revenue, driven by a
fiercely competitive market for experienced private
banking staff, and this led to a deterioration of the
cost efficiency ratio from 50.7 per cent in 2005 to
54.5 per cent in 2006.
Net interest income grew by 21 per cent to
US$35 million. Growth was predominantly in
Singapore, where treasury performance improved and
unfavourable positions unwound, and India, where
the recently launched business was successful in
attracting deposits.
Fee income increased by 62 per cent to
US$68 million, with significant growth in Singapore,
India and the Middle East. Initiatives to attract clients
to HSBC’s suite of discretionary managed products,
particularly the SIS and CIS products, proved
successful.
Trading and other operating income was slightly
lower than in 2005, due to sluggish stock market
performance and correspondingly subdued client
activity.
Client assets increased by 12 per cent to
US$16 billion, benefiting from the recruitment of
front office staff, client appetite for investment in
newly launched funds and the successful growth of
recently launched onshore businesses in the region.
Investment in funds benefited from higher demand
for HSBC and third party manager funds, including
the SIS and CIS products in which the value of client
investments grew to US$291 million. Higher deposits
and investments in equities also contributed to the
growth in client assets.
Operating expenses increased by 25 per cent,
reflecting continued investment in the onshore
Japanese operations and growth of the business in
India. Staff costs rose as competition for front-office
professionals intensified, putting upward pressure on
staff rewards, and the full-year impact of the
expansion in staff recruitment in 2005 fed through.
HSBC sold properties in Japan and India,
realising gains of US$87 million in Other,
US$77 million higher than in 2005. Costs and
recoveries in the Group Service Centres both rose,
reflecting increased activity supported by higher staff
numbers. Interest rate rises and higher retained
earnings led to a doubling of earnings on centrally
held funds.
Year ended 31 December 2005 compared
with year ended 31 December 2004
Economic briefing
Mainland China’s economy grew by 9.9 per cent in
2005. Despite ongoing monetary tightening, total
urban fixed asset investment growth showed no sign
of slowing, though investment in steel and real estate
sectors moderated. Consumer spending also
remained strong, with retail sales growing by 13 per
cent in 2005. Producer price inflation slowed, but
still remained above 3 per cent thanks to strong
investment demand. In July 2005, the People’s Bank
of China announced that, with immediate effect, the
arrangement by which the renminbi (‘RMB’) was
pegged to the US dollar would be replaced with a
managed float. Initially, the exchange rate was set at
US$1 to RMB8.11, equivalent to an appreciation of
approximately 2 per cent. This had little impact on
export growth, which remained very strong, boosting
mainland China’s annual trade surplus from
US$32 billion in 2004 to US$102 billion in 2005.
Growth in food prices slowed as mainland China’s
grain production increased 3 per cent in 2005. This
lowered consumer price inflation to 1.8 per cent from
3.9 per cent at the end of 2004.