HSBC 2006 Annual Report Download - page 186
Download and view the complete annual report
Please find page 186 of the 2006 HSBC annual report below. You can navigate through the pages in the report by either clicking on the pages listed below, or by using the keyword search tool below to find specific information within the annual report.-
 1
1 -
2
-
3
-
4
-
5
-
6
-
7
-
8
-
9
-
10
-
11
-
12
-
13
-
14
-
15
-
16
-
17
-
18
-
19
-
20
-
21
-
22
-
23
-
24
-
25
-
26
-
27
-
28
-
29
-
30
-
31
-
32
-
33
-
34
-
35
-
36
-
37
-
38
-
39
-
40
-
41
-
42
-
43
-
44
-
45
-
46
-
47
-
48
-
49
-
50
-
51
-
52
-
53
-
54
-
55
-
56
-
57
-
58
-
59
-
60
-
61
-
62
-
63
-
64
-
65
-
66
-
67
-
68
-
69
-
70
-
71
-
72
-
73
-
74
-
75
-
76
-
77
-
78
-
79
-
80
-
81
-
82
-
83
-
84
-
85
-
86
-
87
-
88
-
89
-
90
-
91
-
92
-
93
-
94
-
95
-
96
-
97
-
98
-
99
-
100
-
101
-
102
-
103
-
104
-
105
-
106
-
107
-
108
-
109
-
110
-
111
-
112
-
113
-
114
-
115
-
116
-
117
-
118
-
119
-
120
-
121
-
122
-
123
-
124
-
125
-
126
-
127
-
128
-
129
-
130
-
131
-
132
-
133
-
134
-
135
-
136
-
137
-
138
-
139
-
140
-
141
-
142
-
143
-
144
-
145
-
146
-
147
-
148
-
149
-
150
-
151
-
152
-
153
-
154
-
155
-
156
-
157
-
158
-
159
-
160
-
161
-
162
-
163
-
164
-
165
-
166
-
167
-
168
-
169
-
170
-
171
-
172
-
173
-
174
-
175
-
 176
176 -
 177
177 -
 178
178 -
 179
179 -
 180
180 -
 181
181 -
 182
182 -
 183
183 -
 184
184 -
 185
185 -
 186
186 -
 187
187 -
 188
188 -
 189
189 -
 190
190 -
 191
191 -
 192
192 -
 193
193 -
 194
194 -
 195
195 -
 196
196 -
197
-
198
-
199
-
200
-
201
-
202
-
203
-
204
-
205
-
206
-
207
-
208
-
209
-
210
-
211
-
212
-
213
-
214
-
215
-
216
-
217
-
218
-
219
-
220
-
221
-
222
-
223
-
224
-
225
-
226
-
227
-
228
-
229
-
230
-
231
-
232
-
233
-
234
-
235
-
236
-
237
-
238
-
239
-
240
-
241
-
242
-
243
-
244
-
245
-
246
-
247
-
248
-
249
-
250
-
251
-
252
-
253
-
254
-
255
-
256
-
257
-
258
-
259
-
260
-
261
-
262
-
263
-
264
-
265
-
266
-
267
-
268
-
269
-
270
-
271
-
272
-
273
-
274
-
275
-
276
-
277
-
278
-
279
-
280
-
281
-
282
-
283
-
284
-
285
-
286
-
287
-
288
-
289
-
290
-
291
-
292
-
293
-
294
-
295
-
296
-
297
-
298
-
299
-
300
-
301
-
302
-
303
-
304
-
305
-
306
-
307
-
308
-
309
-
310
-
311
-
312
-
313
-
314
-
315
-
316
-
317
-
318
-
319
-
320
-
321
-
322
-
323
-
324
-
325
-
326
-
327
-
328
-
329
-
330
-
331
-
332
-
333
-
334
-
335
-
336
-
337
-
338
-
339
-
340
-
341
-
342
-
343
-
344
-
345
-
346
-
347
-
348
-
349
-
350
-
351
-
352
-
353
-
354
-
355
-
356
-
357
-
358
-
359
-
360
-
361
-
362
-
363
-
364
-
365
-
366
-
367
-
368
-
369
-
370
-
371
-
372
-
373
-
374
-
375
-
376
-
377
-
378
-
379
-
380
-
381
-
382
-
383
-
384
-
385
-
386
-
387
-
388
-
389
-
390
-
391
-
392
-
393
-
394
-
395
-
396
-
397
-
398
-
399
-
400
-
401
-
402
-
403
-
404
-
405
-
406
-
407
-
408
-
409
-
410
-
411
-
412
-
413
-
414
-
415
-
416
-
417
-
418
-
419
-
420
-
421
-
422
-
423
-
424
-
425
-
426
-
427
-
428
-
429
-
430
-
431
-
432
-
433
-
434
-
435
-
436
-
437
-
438
-
439
-
440
-
441
-
442
-
443
-
444
-
445
-
446
-
447
-
448
-
449
-
450
-
451
-
452
-
453
-
454
-
455
-
456
-
457
-
458
 |
 |

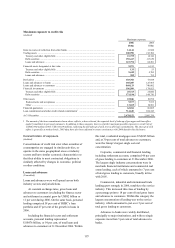
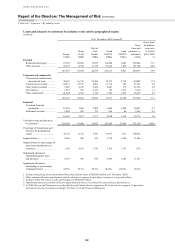
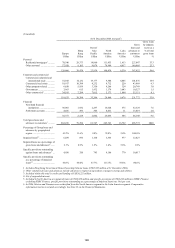
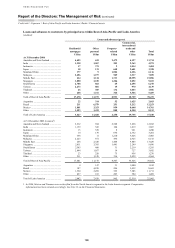
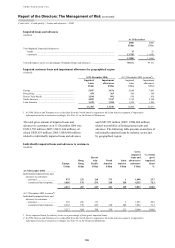
HSBC HOLDINGS PLC
Report of the Directors: The Management of Risk (continued)
Credit risk > Exposure > By industry sector
184
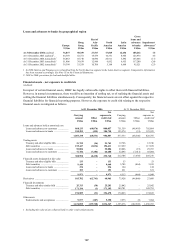
Loans and advances to customers by industry sector and by geographical region (continued)
(Unaudited)
At 31 December 20032 (restated7)
Europe
Hong
Kong
Rest of
Asia-
Pacific
North
America
Latin
America
Gross
loans and
advances to
customers
Gross loans
by industry
sector as a
% of total
gross loans
US$m US$m US$m US$m US$m US$m %
Personal
Residential mortgages1 ............ 51,721 29,954 12,101 76,485 1,493 171,754 31.6
Other personal ......................... 42,041 7,420 7,135 73,717 3,832 134,145 24.7
93,762 37,374 19,236 150,202 5,325 305,899 56.3
Corporate and commercial
Commercial, industrial and
international trade ............... 49,468 10,966 14,892 7,265 3,077 85,668 15.7
Commercial real estate ............ 15,517 8,548 3,149 7,699 175 35,088 6.5
Other property-related ............. 5,416 5,075 2,597 3,850 202 17,140 3.2
Government ............................. 2,462 927 1,450 375 4,376 9,590 1.8
Other commercial3 ................... 24,239 6,754 5,735 5,682 1,620 44,030 8.1
97,102 32,270 27,823 24,871 9,450 191,516 35.3
Financial
Non-bank financial
institutions ........................... 21,226 4,921 2,027 8,588 329 37,091 6.8
Settlement accounts ................. 3,068 556 188 4,767 15 8,594 1.6
24,294 5,477 2,215 13,355 344 45,685 8.4
Total gross loans and advances
to customers4 ............................ 215,158 75,121 49,274 188,428 15,119 543,100 100.0
Percentage of Group loans and
advances by geographical
region ....................................... 39.6% 13.8% 9.1% 34.7% 2.8% 100.0%
Non-performing loans6 ................. 5,701 1,671 1,538 4,889 1,251 15,050
Non-performing loans as a
percentage of gross loans and
advances to customers5 ............ 2.6% 2.2% 3.1% 2.6% 8.3% 2.8%
Specific provisions outstanding
against loans and advances6 .... 3,554 629 981 4,660 1,054 10,878
Specific provisions outstanding
as a percentage of non-
performing loans6 ..................... 62.3% 37.6% 63.8% 95.3% 84.3% 72.3%
1 Includes Hong Kong Government Home Ownership Scheme loans (US$6,290 million at 31 December 2003).
2 Figures presented in this table were prepared in accordance with UK GAAP.
3 Other commercial loans and advances include advances in respect of agriculture, transport, energy and utilities.
4 Included within this total is credit card lending of US$48,634 million.
5 Net of suspended interest.
6 Included in North America are non-performing loans of US$4,335 million and specific provisions of US$4,448 million in HSBC
Finance; excluding HSBC Finance, specific provisions outstanding as a percentage of non-performing loans was 69.2 per cent.
7 In 2006, Mexico and Panama were reclassified from the North America segment to the Latin America segment. Comparative
information has been restated accordingly. See Note 13 on the Financial Statements.