HSBC 2006 Annual Report Download - page 320
Download and view the complete annual report
Please find page 320 of the 2006 HSBC annual report below. You can navigate through the pages in the report by either clicking on the pages listed below, or by using the keyword search tool below to find specific information within the annual report.-
 1
1 -
2
-
3
-
4
-
5
-
6
-
7
-
8
-
9
-
10
-
11
-
12
-
13
-
14
-
15
-
16
-
17
-
18
-
19
-
20
-
21
-
22
-
23
-
24
-
25
-
26
-
27
-
28
-
29
-
30
-
31
-
32
-
33
-
34
-
35
-
36
-
37
-
38
-
39
-
40
-
41
-
42
-
43
-
44
-
45
-
46
-
47
-
48
-
49
-
50
-
51
-
52
-
53
-
54
-
55
-
56
-
57
-
58
-
59
-
60
-
61
-
62
-
63
-
64
-
65
-
66
-
67
-
68
-
69
-
70
-
71
-
72
-
73
-
74
-
75
-
76
-
77
-
78
-
79
-
80
-
81
-
82
-
83
-
84
-
85
-
86
-
87
-
88
-
89
-
90
-
91
-
92
-
93
-
94
-
95
-
96
-
97
-
98
-
99
-
100
-
101
-
102
-
103
-
104
-
105
-
106
-
107
-
108
-
109
-
110
-
111
-
112
-
113
-
114
-
115
-
116
-
117
-
118
-
119
-
120
-
121
-
122
-
123
-
124
-
125
-
126
-
127
-
128
-
129
-
130
-
131
-
132
-
133
-
134
-
135
-
136
-
137
-
138
-
139
-
140
-
141
-
142
-
143
-
144
-
145
-
146
-
147
-
148
-
149
-
150
-
151
-
152
-
153
-
154
-
155
-
156
-
157
-
158
-
159
-
160
-
161
-
162
-
163
-
164
-
165
-
166
-
167
-
168
-
169
-
170
-
171
-
172
-
173
-
174
-
175
-
176
-
177
-
178
-
179
-
180
-
181
-
182
-
183
-
184
-
185
-
186
-
187
-
188
-
189
-
190
-
191
-
192
-
193
-
194
-
195
-
196
-
197
-
198
-
199
-
200
-
201
-
202
-
203
-
204
-
205
-
206
-
207
-
208
-
209
-
210
-
211
-
212
-
213
-
214
-
215
-
216
-
217
-
218
-
219
-
220
-
221
-
222
-
223
-
224
-
225
-
226
-
227
-
228
-
229
-
230
-
231
-
232
-
233
-
234
-
235
-
236
-
237
-
238
-
239
-
240
-
241
-
242
-
243
-
244
-
245
-
246
-
247
-
248
-
249
-
250
-
251
-
252
-
253
-
254
-
255
-
256
-
257
-
258
-
259
-
260
-
261
-
262
-
263
-
264
-
265
-
266
-
267
-
268
-
269
-
270
-
271
-
272
-
273
-
274
-
275
-
276
-
277
-
278
-
279
-
280
-
281
-
282
-
283
-
284
-
285
-
286
-
287
-
288
-
289
-
290
-
291
-
292
-
293
-
294
-
295
-
296
-
297
-
298
-
299
-
300
-
301
-
302
-
303
-
304
-
305
-
306
-
307
-
308
-
309
-
 310
310 -
 311
311 -
 312
312 -
 313
313 -
 314
314 -
 315
315 -
 316
316 -
 317
317 -
 318
318 -
 319
319 -
 320
320 -
 321
321 -
 322
322 -
 323
323 -
 324
324 -
 325
325 -
 326
326 -
 327
327 -
 328
328 -
 329
329 -
 330
330 -
331
-
332
-
333
-
334
-
335
-
336
-
337
-
338
-
339
-
340
-
341
-
342
-
343
-
344
-
345
-
346
-
347
-
348
-
349
-
350
-
351
-
352
-
353
-
354
-
355
-
356
-
357
-
358
-
359
-
360
-
361
-
362
-
363
-
364
-
365
-
366
-
367
-
368
-
369
-
370
-
371
-
372
-
373
-
374
-
375
-
376
-
377
-
378
-
379
-
380
-
381
-
382
-
383
-
384
-
385
-
386
-
387
-
388
-
389
-
390
-
391
-
392
-
393
-
394
-
395
-
396
-
397
-
398
-
399
-
400
-
401
-
402
-
403
-
404
-
405
-
406
-
407
-
408
-
409
-
410
-
411
-
412
-
413
-
414
-
415
-
416
-
417
-
418
-
419
-
420
-
421
-
422
-
423
-
424
-
425
-
426
-
427
-
428
-
429
-
430
-
431
-
432
-
433
-
434
-
435
-
436
-
437
-
438
-
439
-
440
-
441
-
442
-
443
-
444
-
445
-
446
-
447
-
448
-
449
-
450
-
451
-
452
-
453
-
454
-
455
-
456
-
457
-
458
 |
 |

HSBC HOLDINGS PLC
Notes on the Financial Statements (continued)
Notes 4, 5 and 6
318
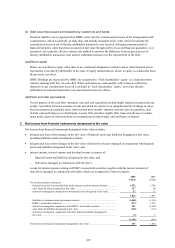
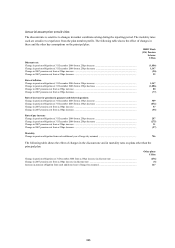
1 Gains and losses from changes in the fair value of HSBC’s issued debt securities may arise from changes in HSBC’s own credit risk. In
2006, HSBC recognised a US$388 million loss on changes in the fair value of these instruments arising from changes in HSBC’s own
credit risk (2005: loss US$70 million).
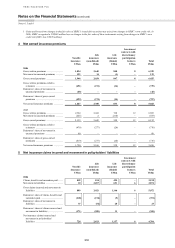
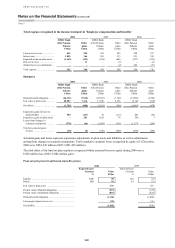
4 Net earned insurance premiums
Non-life
insurance
Life
insurance
(non-linked)
Life
insurance
(linked)
Investment
contracts with
discretionary
participation
features Total
US$m US$m US$m US$m US$m
2006
Gross written premiums ............................ 1,824 3,640 848 8 6,320
Movement in unearned premiums ............ 122 14 (1) – 135
Gross earned premiums ............................ 1,946 3,654 847 8 6,455
Gross written premiums ceded to
reinsurers .............................................. (451) (274) (14) – (739)
Reinsurers’ share of movement in
unearned premiums .............................. (48) – – – (48)
Reinsurers’ share of gross earned
premiums .............................................. (499) (274) (14) – (787)
Net earned insurance premiums ............... 1,447 3,380 833 8 5,668
2005
Gross written premiums ............................ 2,364 3,441 768 12 6,585
Movement in unearned premiums ............ (225) 2 (210) – (433)
Gross earned premiums ............................ 2,139 3,443 558 12 6,152
Gross written premiums ceded to
reinsurers .............................................. (479) (277) (20) – (776)
Reinsurers’ share of movement in
unearned premiums .............................. 60 – – – 60
Reinsurers’ share of gross earned
premiums .............................................. (419) (277) (20) – (716)
Net earned insurance premiums ............... 1,720 3,166 538 12 5,436
5 Net insurance claims incurred and movement in policyholders’ liabilities
Non-life
insurance
Life
insurance
(non-linked)
Life
insurance
(linked)
Investment
contracts with
discretionary
participation
features Total
US$m US$m US$m US$m US$m
2006
Claims, benefits and surrenders paid ........ 889 814 495 – 2,198
Movement in liabilities ............................. 10 2,207 651 6 2,874
Gross claims incurred and movement in
liabilities ............................................... 899 3,021 1,146 6 5,072
Reinsurers’ share of claims, benefits and
surrenders paid ..................................... (228) (154) (9) – (391)
Reinsurers’ share of movement in
liabilities ............................................... 57 (54) 20 – 23
Reinsurers’ share of claims incurred and
movement in liabilities .......................... (171) (208) 11 – (368)
Net insurance claims incurred and
movement in policyholders’
liabilities ............................................... 728 2,813 1,157 6 4,704