HSBC 2006 Annual Report Download - page 384
Download and view the complete annual report
Please find page 384 of the 2006 HSBC annual report below. You can navigate through the pages in the report by either clicking on the pages listed below, or by using the keyword search tool below to find specific information within the annual report.-
 1
1 -
2
-
3
-
4
-
5
-
6
-
7
-
8
-
9
-
10
-
11
-
12
-
13
-
14
-
15
-
16
-
17
-
18
-
19
-
20
-
21
-
22
-
23
-
24
-
25
-
26
-
27
-
28
-
29
-
30
-
31
-
32
-
33
-
34
-
35
-
36
-
37
-
38
-
39
-
40
-
41
-
42
-
43
-
44
-
45
-
46
-
47
-
48
-
49
-
50
-
51
-
52
-
53
-
54
-
55
-
56
-
57
-
58
-
59
-
60
-
61
-
62
-
63
-
64
-
65
-
66
-
67
-
68
-
69
-
70
-
71
-
72
-
73
-
74
-
75
-
76
-
77
-
78
-
79
-
80
-
81
-
82
-
83
-
84
-
85
-
86
-
87
-
88
-
89
-
90
-
91
-
92
-
93
-
94
-
95
-
96
-
97
-
98
-
99
-
100
-
101
-
102
-
103
-
104
-
105
-
106
-
107
-
108
-
109
-
110
-
111
-
112
-
113
-
114
-
115
-
116
-
117
-
118
-
119
-
120
-
121
-
122
-
123
-
124
-
125
-
126
-
127
-
128
-
129
-
130
-
131
-
132
-
133
-
134
-
135
-
136
-
137
-
138
-
139
-
140
-
141
-
142
-
143
-
144
-
145
-
146
-
147
-
148
-
149
-
150
-
151
-
152
-
153
-
154
-
155
-
156
-
157
-
158
-
159
-
160
-
161
-
162
-
163
-
164
-
165
-
166
-
167
-
168
-
169
-
170
-
171
-
172
-
173
-
174
-
175
-
176
-
177
-
178
-
179
-
180
-
181
-
182
-
183
-
184
-
185
-
186
-
187
-
188
-
189
-
190
-
191
-
192
-
193
-
194
-
195
-
196
-
197
-
198
-
199
-
200
-
201
-
202
-
203
-
204
-
205
-
206
-
207
-
208
-
209
-
210
-
211
-
212
-
213
-
214
-
215
-
216
-
217
-
218
-
219
-
220
-
221
-
222
-
223
-
224
-
225
-
226
-
227
-
228
-
229
-
230
-
231
-
232
-
233
-
234
-
235
-
236
-
237
-
238
-
239
-
240
-
241
-
242
-
243
-
244
-
245
-
246
-
247
-
248
-
249
-
250
-
251
-
252
-
253
-
254
-
255
-
256
-
257
-
258
-
259
-
260
-
261
-
262
-
263
-
264
-
265
-
266
-
267
-
268
-
269
-
270
-
271
-
272
-
273
-
274
-
275
-
276
-
277
-
278
-
279
-
280
-
281
-
282
-
283
-
284
-
285
-
286
-
287
-
288
-
289
-
290
-
291
-
292
-
293
-
294
-
295
-
296
-
297
-
298
-
299
-
300
-
301
-
302
-
303
-
304
-
305
-
306
-
307
-
308
-
309
-
310
-
311
-
312
-
313
-
314
-
315
-
316
-
317
-
318
-
319
-
320
-
321
-
322
-
323
-
324
-
325
-
326
-
327
-
328
-
329
-
330
-
331
-
332
-
333
-
334
-
335
-
336
-
337
-
338
-
339
-
340
-
341
-
342
-
343
-
344
-
345
-
346
-
347
-
348
-
349
-
350
-
351
-
352
-
353
-
354
-
355
-
356
-
357
-
358
-
359
-
360
-
361
-
362
-
363
-
364
-
365
-
366
-
367
-
368
-
369
-
370
-
371
-
372
-
373
-
 374
374 -
 375
375 -
 376
376 -
 377
377 -
 378
378 -
 379
379 -
 380
380 -
 381
381 -
 382
382 -
 383
383 -
 384
384 -
 385
385 -
 386
386 -
 387
387 -
 388
388 -
 389
389 -
 390
390 -
 391
391 -
 392
392 -
 393
393 -
 394
394 -
395
-
396
-
397
-
398
-
399
-
400
-
401
-
402
-
403
-
404
-
405
-
406
-
407
-
408
-
409
-
410
-
411
-
412
-
413
-
414
-
415
-
416
-
417
-
418
-
419
-
420
-
421
-
422
-
423
-
424
-
425
-
426
-
427
-
428
-
429
-
430
-
431
-
432
-
433
-
434
-
435
-
436
-
437
-
438
-
439
-
440
-
441
-
442
-
443
-
444
-
445
-
446
-
447
-
448
-
449
-
450
-
451
-
452
-
453
-
454
-
455
-
456
-
457
-
458
 |
 |

HSBC HOLDINGS PLC
Notes on the Financial Statements (continued)
Notes 33 and 34
382
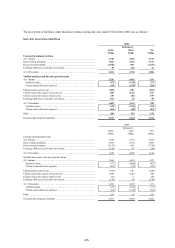
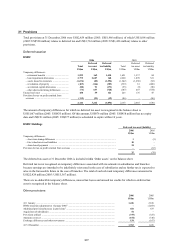
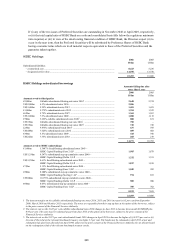
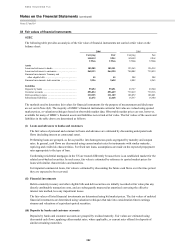
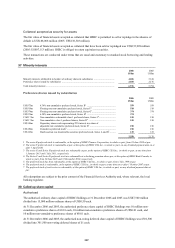
33 Fair values of financial instruments
HSBC
The following table provides an analysis of the fair value of financial instruments not carried at fair value on the
balance sheet:
2006 2005
Carrying
amount
Fair
value
Carrying
amount
Fair
value
US$m US$m US$m US$m
Assets
Loans and advances to banks ....................................... 185,205 185,151 125,965 126,218
Loans and advances to customers ................................. 868,133 864,320 740,002 739,439
Financial investments: Treasury and
other eligible bills ..................................................... 45 45 208 208
Financial investments: debt securities .......................... 9,326 9,628 8,082 8,263
Liabilities
Deposits by banks ......................................................... 99,694 99,691 69,727 69,540
Customer accounts ........................................................ 896,834 896,429 739,419 739,316
Debt securities in issue ................................................. 230,325 231,189 188,072 188,401
Subordinated liabilities ................................................. 22,672 22,468 16,537 16,380
The methods used to determine fair values for financial instruments for the purpose of measurement and disclosure
are set out in Note 2(d). The majority of HSBC’s financial instruments carried at fair value are valued using quoted
market prices, or valuation techniques based on observable market data. Observable market prices are not, however,
available for many of HSBC’s financial assets and liabilities not carried at fair value. The fair values of the assets and
liabilities in the table above are determined as follows:
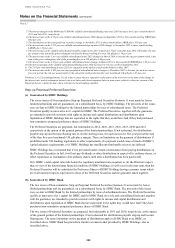
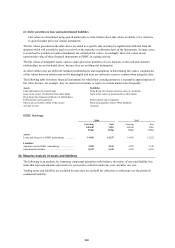
(i) Loans and advances to banks and customers
The fair values of personal and commercial loans and advances are estimated by discounting anticipated cash
flows (including interest at contractual rates).
Performing loans are grouped, as far as possible, into homogeneous pools segregated by maturity and coupon
rates. In general, cash flows are discounted using current market rates for instruments with similar maturity,
repricing and credit risk characteristics. For fixed rate loans, assumptions are made on the expected prepayment
rates appropriate to the type of loan.
Conforming residential mortgages in the US are treated differently because there is an established market for the
related asset-backed securities. In such cases, fair value is estimated by reference to quoted market prices for
loans with similar characteristics and maturities.
For impaired commercial loans, fair value is estimated by discounting the future cash flows over the time period
they are expected to be recovered.
(ii) Financial investments
Held-to-maturity treasury and other eligible bills and debt securities are initially recorded at fair value plus any
directly attributable transaction costs, and are subsequently measured at amortised cost using the effective
interest rate method, less any impairment losses.
The fair values of listed financial investments are determined using bid market prices. The fair values of unlisted
financial investments are determined using valuation techniques that take into consideration future earnings
streams and valuations of equivalent quoted securities.
(iii) Deposits by banks and customer accounts
Deposits by banks and customer accounts are grouped by residual maturity. Fair values are estimated using
discounted cash flows, applying either market rates, where applicable, or current rates offered for deposits of
similar remaining maturities.