HSBC 2006 Annual Report Download - page 35
Download and view the complete annual report
Please find page 35 of the 2006 HSBC annual report below. You can navigate through the pages in the report by either clicking on the pages listed below, or by using the keyword search tool below to find specific information within the annual report.-
 1
1 -
2
-
3
-
4
-
5
-
6
-
7
-
8
-
9
-
10
-
11
-
12
-
13
-
14
-
15
-
16
-
17
-
18
-
19
-
20
-
21
-
22
-
23
-
24
-
 25
25 -
 26
26 -
 27
27 -
 28
28 -
 29
29 -
 30
30 -
 31
31 -
 32
32 -
 33
33 -
 34
34 -
 35
35 -
 36
36 -
 37
37 -
 38
38 -
 39
39 -
 40
40 -
 41
41 -
 42
42 -
 43
43 -
 44
44 -
 45
45 -
46
-
47
-
48
-
49
-
50
-
51
-
52
-
53
-
54
-
55
-
56
-
57
-
58
-
59
-
60
-
61
-
62
-
63
-
64
-
65
-
66
-
67
-
68
-
69
-
70
-
71
-
72
-
73
-
74
-
75
-
76
-
77
-
78
-
79
-
80
-
81
-
82
-
83
-
84
-
85
-
86
-
87
-
88
-
89
-
90
-
91
-
92
-
93
-
94
-
95
-
96
-
97
-
98
-
99
-
100
-
101
-
102
-
103
-
104
-
105
-
106
-
107
-
108
-
109
-
110
-
111
-
112
-
113
-
114
-
115
-
116
-
117
-
118
-
119
-
120
-
121
-
122
-
123
-
124
-
125
-
126
-
127
-
128
-
129
-
130
-
131
-
132
-
133
-
134
-
135
-
136
-
137
-
138
-
139
-
140
-
141
-
142
-
143
-
144
-
145
-
146
-
147
-
148
-
149
-
150
-
151
-
152
-
153
-
154
-
155
-
156
-
157
-
158
-
159
-
160
-
161
-
162
-
163
-
164
-
165
-
166
-
167
-
168
-
169
-
170
-
171
-
172
-
173
-
174
-
175
-
176
-
177
-
178
-
179
-
180
-
181
-
182
-
183
-
184
-
185
-
186
-
187
-
188
-
189
-
190
-
191
-
192
-
193
-
194
-
195
-
196
-
197
-
198
-
199
-
200
-
201
-
202
-
203
-
204
-
205
-
206
-
207
-
208
-
209
-
210
-
211
-
212
-
213
-
214
-
215
-
216
-
217
-
218
-
219
-
220
-
221
-
222
-
223
-
224
-
225
-
226
-
227
-
228
-
229
-
230
-
231
-
232
-
233
-
234
-
235
-
236
-
237
-
238
-
239
-
240
-
241
-
242
-
243
-
244
-
245
-
246
-
247
-
248
-
249
-
250
-
251
-
252
-
253
-
254
-
255
-
256
-
257
-
258
-
259
-
260
-
261
-
262
-
263
-
264
-
265
-
266
-
267
-
268
-
269
-
270
-
271
-
272
-
273
-
274
-
275
-
276
-
277
-
278
-
279
-
280
-
281
-
282
-
283
-
284
-
285
-
286
-
287
-
288
-
289
-
290
-
291
-
292
-
293
-
294
-
295
-
296
-
297
-
298
-
299
-
300
-
301
-
302
-
303
-
304
-
305
-
306
-
307
-
308
-
309
-
310
-
311
-
312
-
313
-
314
-
315
-
316
-
317
-
318
-
319
-
320
-
321
-
322
-
323
-
324
-
325
-
326
-
327
-
328
-
329
-
330
-
331
-
332
-
333
-
334
-
335
-
336
-
337
-
338
-
339
-
340
-
341
-
342
-
343
-
344
-
345
-
346
-
347
-
348
-
349
-
350
-
351
-
352
-
353
-
354
-
355
-
356
-
357
-
358
-
359
-
360
-
361
-
362
-
363
-
364
-
365
-
366
-
367
-
368
-
369
-
370
-
371
-
372
-
373
-
374
-
375
-
376
-
377
-
378
-
379
-
380
-
381
-
382
-
383
-
384
-
385
-
386
-
387
-
388
-
389
-
390
-
391
-
392
-
393
-
394
-
395
-
396
-
397
-
398
-
399
-
400
-
401
-
402
-
403
-
404
-
405
-
406
-
407
-
408
-
409
-
410
-
411
-
412
-
413
-
414
-
415
-
416
-
417
-
418
-
419
-
420
-
421
-
422
-
423
-
424
-
425
-
426
-
427
-
428
-
429
-
430
-
431
-
432
-
433
-
434
-
435
-
436
-
437
-
438
-
439
-
440
-
441
-
442
-
443
-
444
-
445
-
446
-
447
-
448
-
449
-
450
-
451
-
452
-
453
-
454
-
455
-
456
-
457
-
458
 |
 |
33
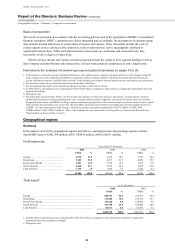
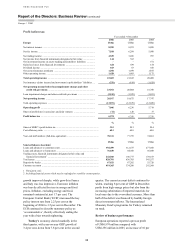
cent. On an underlying basis, pre-tax profits grew by
8 per cent. Underlying net operating income
increased by 9 per cent, in line with operating
expenses. Commercial Banking delivered a third
successive year of growth, driven by strong balance
sheet growth in the UK and organic expansion in
Turkey. Record profits in Private Banking were
driven by strong client asset inflows, a more
sophisticated product mix and lending growth.
Corporate, Investment Banking and Markets made
encouraging gains in trading activities, and operating
expenses rose in line with net operating income. In
Personal Financial Services, net operating income
growth slowed as HSBC tightened its underwriting
criteria on unsecured credit. An emphasis on deposit,
wealth and insurance products contributed to an
increase in costs, which were driven by
infrastructure investment both in the physical
environment and direct channels.
The following commentary is on an underlying
basis.
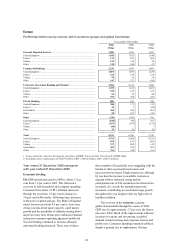
Personal Financial Services reported a pre-tax
profit of US$1,909 million, 2 per cent lower than in
2005. Net operating income rose by 4 per cent and
loan impairment charges increased by slightly more
than revenues as increasing numbers of debtors
sought formal protection from their obligations.
Costs grew by 7 per cent, reflecting investment in
infrastructure throughout the region, and the cost
efficiency ratio rose by 1.2 percentage points to
59.2 per cent.
In the UK, HSBC responded to concerns over
high levels of consumer indebtedness and the growth
in personal bankruptcies and IVAs by adopting more
selective underwriting criteria and reducing credit
origination. Revenues from credit-related insurance
declined as a consequence. In response, HSBC
increased its focus on non credit-related income
streams, particularly savings and high-value current
accounts. Strong balance growth in these products
was achieved through marketing initiatives,
competitive pricing and the success of innovative
propositions such as the packaged ‘Plus’ and
‘Passport’ current accounts, the latter supported by
the implementation during the year of a more refined
approach to customer segmentation.
Considerable strategic attention was given to
enhancing product distribution and channel
management. The branch refurbishment programme
continued and improvements were made to direct
banking, notably the introduction of self-service
machines and the upgrading of cash machine service
offerings. HSBC’s internet offering was also
enhanced to offer personalised content and sales
capabilities, with improved customer accessibility.
In France, a marked improvement in brand
awareness after the 2005 rebranding to ‘HSBC
France’, supported by competitive pricing, aided the
recruitment of target customers and consequential
balance sheet growth, most notably in residential
property lending. Despite this growth, there was a
decline in profit before tax, due to competitive
pressures on margin and the time lag between
incurring costs on customer acquisition and earning
incremental revenue from future opportunities to
cross-sell.
In Turkey profit before tax declined by 2 per
cent, as revenue growth was offset by investment
costs. Organic development was furthered by the
opening of 37 new branches during the year,
bringing the total to 193, and a number of marketing
initiatives to build brand awareness. Balance sheet
and revenue growth accelerated as a result, as did
customer recruitment. Overall customer numbers
stood at 2.3 million at the end of 2006.
Net interest income increased by 5 per cent to
US$5,653 million, substantially from balance sheet
growth throughout the region.
In the UK, net interest income was driven by
growth in savings, deposit and current accounts, with
higher balances achieved through targeted sales and
marketing efforts. Interest income from credit cards
and mortgages also increased.
A focus on liabilities helped boost new UK
savings account volumes markedly in a buoyant yet
highly competitive savings market. HSBC’s
competitive internet-based products were the key
driver of growth. Cash invested in First Direct’s
‘e-savings’ product trebled; balances in HSBC’s
‘Online Saver’ increased sixfold. Overall, average
savings balances, excluding money market
investments, increased by 28 per cent and net
interest income rose by 25 per cent.
Current account balances in the UK increased
by 6 per cent to US$26.0 billion. Within this, the
proportion of value-added packaged current accounts
attracting fees rose significantly. The number of
HSBC’s fee-based accounts more than doubled
during 2006. In aggregate, packaged current account
balances increased by 25 per cent and represented
nearly half of the overall increase in current
accounts. Spreads remained broadly in line with
2005.
Average UK credit card balances rose by 5 per
cent, to US$13.7 billion, driven by promotional
campaigns and marketing. Growth was strongest in