HSBC 2006 Annual Report Download - page 140
Download and view the complete annual report
Please find page 140 of the 2006 HSBC annual report below. You can navigate through the pages in the report by either clicking on the pages listed below, or by using the keyword search tool below to find specific information within the annual report.-
 1
1 -
2
-
3
-
4
-
5
-
6
-
7
-
8
-
9
-
10
-
11
-
12
-
13
-
14
-
15
-
16
-
17
-
18
-
19
-
20
-
21
-
22
-
23
-
24
-
25
-
26
-
27
-
28
-
29
-
30
-
31
-
32
-
33
-
34
-
35
-
36
-
37
-
38
-
39
-
40
-
41
-
42
-
43
-
44
-
45
-
46
-
47
-
48
-
49
-
50
-
51
-
52
-
53
-
54
-
55
-
56
-
57
-
58
-
59
-
60
-
61
-
62
-
63
-
64
-
65
-
66
-
67
-
68
-
69
-
70
-
71
-
72
-
73
-
74
-
75
-
76
-
77
-
78
-
79
-
80
-
81
-
82
-
83
-
84
-
85
-
86
-
87
-
88
-
89
-
90
-
91
-
92
-
93
-
94
-
95
-
96
-
97
-
98
-
99
-
100
-
101
-
102
-
103
-
104
-
105
-
106
-
107
-
108
-
109
-
110
-
111
-
112
-
113
-
114
-
115
-
116
-
117
-
118
-
119
-
120
-
121
-
122
-
123
-
124
-
125
-
126
-
127
-
128
-
129
-
 130
130 -
 131
131 -
 132
132 -
 133
133 -
 134
134 -
 135
135 -
 136
136 -
 137
137 -
 138
138 -
 139
139 -
 140
140 -
 141
141 -
 142
142 -
 143
143 -
 144
144 -
 145
145 -
 146
146 -
 147
147 -
 148
148 -
 149
149 -
 150
150 -
151
-
152
-
153
-
154
-
155
-
156
-
157
-
158
-
159
-
160
-
161
-
162
-
163
-
164
-
165
-
166
-
167
-
168
-
169
-
170
-
171
-
172
-
173
-
174
-
175
-
176
-
177
-
178
-
179
-
180
-
181
-
182
-
183
-
184
-
185
-
186
-
187
-
188
-
189
-
190
-
191
-
192
-
193
-
194
-
195
-
196
-
197
-
198
-
199
-
200
-
201
-
202
-
203
-
204
-
205
-
206
-
207
-
208
-
209
-
210
-
211
-
212
-
213
-
214
-
215
-
216
-
217
-
218
-
219
-
220
-
221
-
222
-
223
-
224
-
225
-
226
-
227
-
228
-
229
-
230
-
231
-
232
-
233
-
234
-
235
-
236
-
237
-
238
-
239
-
240
-
241
-
242
-
243
-
244
-
245
-
246
-
247
-
248
-
249
-
250
-
251
-
252
-
253
-
254
-
255
-
256
-
257
-
258
-
259
-
260
-
261
-
262
-
263
-
264
-
265
-
266
-
267
-
268
-
269
-
270
-
271
-
272
-
273
-
274
-
275
-
276
-
277
-
278
-
279
-
280
-
281
-
282
-
283
-
284
-
285
-
286
-
287
-
288
-
289
-
290
-
291
-
292
-
293
-
294
-
295
-
296
-
297
-
298
-
299
-
300
-
301
-
302
-
303
-
304
-
305
-
306
-
307
-
308
-
309
-
310
-
311
-
312
-
313
-
314
-
315
-
316
-
317
-
318
-
319
-
320
-
321
-
322
-
323
-
324
-
325
-
326
-
327
-
328
-
329
-
330
-
331
-
332
-
333
-
334
-
335
-
336
-
337
-
338
-
339
-
340
-
341
-
342
-
343
-
344
-
345
-
346
-
347
-
348
-
349
-
350
-
351
-
352
-
353
-
354
-
355
-
356
-
357
-
358
-
359
-
360
-
361
-
362
-
363
-
364
-
365
-
366
-
367
-
368
-
369
-
370
-
371
-
372
-
373
-
374
-
375
-
376
-
377
-
378
-
379
-
380
-
381
-
382
-
383
-
384
-
385
-
386
-
387
-
388
-
389
-
390
-
391
-
392
-
393
-
394
-
395
-
396
-
397
-
398
-
399
-
400
-
401
-
402
-
403
-
404
-
405
-
406
-
407
-
408
-
409
-
410
-
411
-
412
-
413
-
414
-
415
-
416
-
417
-
418
-
419
-
420
-
421
-
422
-
423
-
424
-
425
-
426
-
427
-
428
-
429
-
430
-
431
-
432
-
433
-
434
-
435
-
436
-
437
-
438
-
439
-
440
-
441
-
442
-
443
-
444
-
445
-
446
-
447
-
448
-
449
-
450
-
451
-
452
-
453
-
454
-
455
-
456
-
457
-
458
 |
 |

HSBC HOLDINGS PLC
Report of the Directors: Financial Review (continued)
Loan impairment charges / Operating expenses
138
in delinquency and loss severity, projecting the
probable impact of re-pricing ARMs, and
incorporating the effect of re-pricing on parallel
second lien loans. Further details are provided on
page 189. Credit delinquency in other parts of the
mortgage portfolio and in other US businesses rose
modestly, driven by unusually low levels at the end
of 2005, and growing loan maturity in 2006.
Partially offsetting the effects of credit deterioration
were a decline in bankruptcy filings following the
surge at the end of 2005, relatively low
unemployment and a fall in exposure estimated to
result from hurricane Katrina.
In Latin America, the rise in impairment charges
by 24 per cent to US$938 million was largely
recorded in Mexico and, to a lesser extent, Brazil
and Argentina. In Mexico, strong loan growth,
particularly in 2006, led to increased loan
impairment charges. In Brazil, the credit weaknesses
seen in 2005 and the first half of 2006, particularly
in the consumer market, were mitigated by changes
to underwriting procedures. Net charges in Brazil
increased by 7 per cent compared with 54 per cent in
2005 and declined in the second half of 2006
compared with the first half. In Argentina, net
charges rose as a result of the non-recurrence of
releases and recoveries in 2005.
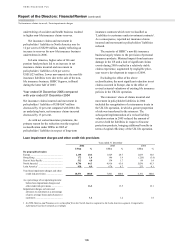
The aggregate outstanding customer loan
impairment allowances at 31 December 2006 of
US$13,578 million represented 1.6 per cent of gross
customer advances (net of reverse repos and
settlement accounts), compared with 1.5 per cent at
the same time in 2005.
Impaired loans to customers were
US$13,785 million at 31 December 2006 compared
with US$11,446 million at 31 December 2005. On a
constant currency basis, impaired loans were 14 per
cent higher than in 2005 compared with lending
growth (excluding loans to the financial sector and
settlement accounts) of 10 per cent.
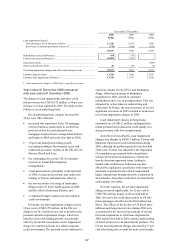
Year ended 31 December 2005 compared
with year ended 31 December 2004
During 2005, the underlying growth in customer
lending excluding loans to the financial sector and
the impact of grossing adjustments required from
1 January 2005 under IFRSs, was 12 per cent.
Personal lending accounted for 63 per cent of this
increase, principally in mortgages, credit cards and
other personal lending products. At 31 December
2005, personal lending accounted for 56 per cent of
the customer loan portfolio, in line with 2004. The
proportion of the portfolio attributable to corporate
and commercial lending was augmented by the
IFRSs adjustment noted above. Residential
mortgages comprised 56 per cent of the personal
lending portfolio.
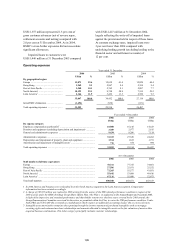
The charge for loan impairment adjusts the
balance sheet allowance for loan impairment to the
level that management deems adequate to absorb
actual and inherent losses in the Group’s loan
portfolios. The majority of the Group’s loan
impairment charges were determined on a portfolio
basis, employing statistical calculations using roll
rate methodologies. The total charge for loan
impairment and other credit risk provisions in 2005
was US$7,801 million compared with a total charge
of US$6,191 million in 2004, a rise of 26 per cent.
This reflected:
• underlying growth in lending of 12 per cent;
• a weakening credit environment in the UK and
Brazil but an improved credit experience in the
US; and
• the non-recurrence of the 2004 net release of
general provision of US$498 million.
In the US, the underlying trend in loan
impairment charges was favourable compared with
2004, notwithstanding the negative effect on loan
impairment charges of hurricane Katrina and a surge
in personal bankruptcies in October ahead of new
legislation making such declarations more onerous.
This was due to a change in portfolio mix towards
higher quality lending and a positive economic
environment.
In the UK, credit costs rose following an
expansion in personal lending, which was
accompanied by an increase in delinquencies as the
economy slowed during 2005. This was evidenced
by rising personal bankruptcy, caused in part by
legislative changes which facilitated debt
reconstruction procedures, an increase in
unemployment and higher levels of personal debt. In
Hong Kong, the credit environment remained
benign, with falling bankruptcies contributing to a
modest reduction in loan impairment allowances in
the personal sector. A fall in releases in the corporate
sector, however, contributed to a modest charge for
loan impairment as compared with a net release in
2004. In the Rest of Asia-Pacific, continuing releases
and recoveries partly offset the impact of lending
growth in the region. Higher charges in the personal
sector in Brazil followed intense competitive
pressure in the consumer segment, where significant
increases in the availability of credit led to customers
becoming over-indebted.
The aggregate customer loan impairment
allowances at 31 December 2005 of