HSBC 2006 Annual Report Download - page 60
Download and view the complete annual report
Please find page 60 of the 2006 HSBC annual report below. You can navigate through the pages in the report by either clicking on the pages listed below, or by using the keyword search tool below to find specific information within the annual report.-
 1
1 -
2
-
3
-
4
-
5
-
6
-
7
-
8
-
9
-
10
-
11
-
12
-
13
-
14
-
15
-
16
-
17
-
18
-
19
-
20
-
21
-
22
-
23
-
24
-
25
-
26
-
27
-
28
-
29
-
30
-
31
-
32
-
33
-
34
-
35
-
36
-
37
-
38
-
39
-
40
-
41
-
42
-
43
-
44
-
45
-
46
-
47
-
48
-
49
-
 50
50 -
 51
51 -
 52
52 -
 53
53 -
 54
54 -
 55
55 -
 56
56 -
 57
57 -
 58
58 -
 59
59 -
 60
60 -
 61
61 -
 62
62 -
 63
63 -
 64
64 -
 65
65 -
 66
66 -
 67
67 -
 68
68 -
 69
69 -
 70
70 -
71
-
72
-
73
-
74
-
75
-
76
-
77
-
78
-
79
-
80
-
81
-
82
-
83
-
84
-
85
-
86
-
87
-
88
-
89
-
90
-
91
-
92
-
93
-
94
-
95
-
96
-
97
-
98
-
99
-
100
-
101
-
102
-
103
-
104
-
105
-
106
-
107
-
108
-
109
-
110
-
111
-
112
-
113
-
114
-
115
-
116
-
117
-
118
-
119
-
120
-
121
-
122
-
123
-
124
-
125
-
126
-
127
-
128
-
129
-
130
-
131
-
132
-
133
-
134
-
135
-
136
-
137
-
138
-
139
-
140
-
141
-
142
-
143
-
144
-
145
-
146
-
147
-
148
-
149
-
150
-
151
-
152
-
153
-
154
-
155
-
156
-
157
-
158
-
159
-
160
-
161
-
162
-
163
-
164
-
165
-
166
-
167
-
168
-
169
-
170
-
171
-
172
-
173
-
174
-
175
-
176
-
177
-
178
-
179
-
180
-
181
-
182
-
183
-
184
-
185
-
186
-
187
-
188
-
189
-
190
-
191
-
192
-
193
-
194
-
195
-
196
-
197
-
198
-
199
-
200
-
201
-
202
-
203
-
204
-
205
-
206
-
207
-
208
-
209
-
210
-
211
-
212
-
213
-
214
-
215
-
216
-
217
-
218
-
219
-
220
-
221
-
222
-
223
-
224
-
225
-
226
-
227
-
228
-
229
-
230
-
231
-
232
-
233
-
234
-
235
-
236
-
237
-
238
-
239
-
240
-
241
-
242
-
243
-
244
-
245
-
246
-
247
-
248
-
249
-
250
-
251
-
252
-
253
-
254
-
255
-
256
-
257
-
258
-
259
-
260
-
261
-
262
-
263
-
264
-
265
-
266
-
267
-
268
-
269
-
270
-
271
-
272
-
273
-
274
-
275
-
276
-
277
-
278
-
279
-
280
-
281
-
282
-
283
-
284
-
285
-
286
-
287
-
288
-
289
-
290
-
291
-
292
-
293
-
294
-
295
-
296
-
297
-
298
-
299
-
300
-
301
-
302
-
303
-
304
-
305
-
306
-
307
-
308
-
309
-
310
-
311
-
312
-
313
-
314
-
315
-
316
-
317
-
318
-
319
-
320
-
321
-
322
-
323
-
324
-
325
-
326
-
327
-
328
-
329
-
330
-
331
-
332
-
333
-
334
-
335
-
336
-
337
-
338
-
339
-
340
-
341
-
342
-
343
-
344
-
345
-
346
-
347
-
348
-
349
-
350
-
351
-
352
-
353
-
354
-
355
-
356
-
357
-
358
-
359
-
360
-
361
-
362
-
363
-
364
-
365
-
366
-
367
-
368
-
369
-
370
-
371
-
372
-
373
-
374
-
375
-
376
-
377
-
378
-
379
-
380
-
381
-
382
-
383
-
384
-
385
-
386
-
387
-
388
-
389
-
390
-
391
-
392
-
393
-
394
-
395
-
396
-
397
-
398
-
399
-
400
-
401
-
402
-
403
-
404
-
405
-
406
-
407
-
408
-
409
-
410
-
411
-
412
-
413
-
414
-
415
-
416
-
417
-
418
-
419
-
420
-
421
-
422
-
423
-
424
-
425
-
426
-
427
-
428
-
429
-
430
-
431
-
432
-
433
-
434
-
435
-
436
-
437
-
438
-
439
-
440
-
441
-
442
-
443
-
444
-
445
-
446
-
447
-
448
-
449
-
450
-
451
-
452
-
453
-
454
-
455
-
456
-
457
-
458
 |
 |

HSBC HOLDINGS PLC
Report of the Directors: Business Review (continued)
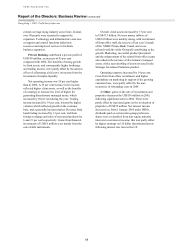
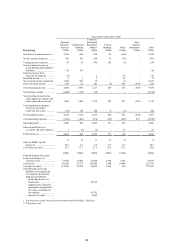
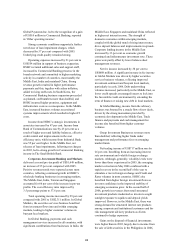
Hong Kong > Profit/(loss) before tax
58
Profit/(loss) before tax by customer groups and global businesses (continued)
Year ended 31 December 2005
Hong Kong
Personal
Financial
Services
US$m
Commercial
Banking
US$m
Corporate,
Investment
Banking &
Markets
US$m
Private
Banking
US$m
Other
US$m
Inter-
segment
elimination
US$m
Total
US$m
Net interest income/(expense) .... 2,618 1,096 607 75 (529) 197 4,064
Net fee income ............................ 740 402 431 93 8 – 1,674
Trading income/(expense)
excluding net interest income 67 48 601 140 (83) – 773
Net interest income/(expense)
on trading activities ................ – – (40) – 10 (197) (227)
Net trading income/(expense) ..... 67 48 561 140 (73) (197) 546
Net income/(expense) from
financial instruments
designated at fair value ........... 41 (84) 14 – 23 – (6)
Gains less losses from
financial investments .............. – – – 16 92 – 108
Dividend income ......................... 1 2 18 – 20 – 41
Net earned insurance premiums .. 2,238 77 19 – – – 2,334
Other operating income .............. 230 35 83 13 682 (238) 805
Total operating income ............... 5,935 1,576 1,733 337 223 (238) 9,566
Net insurance claims1 ................. (2,016) (34) (9) – – – (2,059)
Net operating income before
loan impairment charges and
other credit risk provisions ..... 3,919 1,542 1,724 337 223 (238) 7,507
Loan impairment (charges)/
recoveries and other credit
risk provisions ........................ 11 (168) 7 3 1 – (146)
Net operating income ................. 3,930 1,374 1,731 340 224 (238) 7,361
Total operating expenses ............ (1,305) (419) (809) (150) (422) 238 (2,867)
Operating profit/(loss) ................. 2,625 955 922 190 (198) – 4,494
Share of profit in associates
and joint ventures ................... 3 – – – 20 – 23
Profit/(loss) before tax ................ 2,628 955 922 190 (178) – 4,517
% % % % % %
Share of HSBC’s profit
before tax ................................ 12.5 4.6 4.4 0.9 (0.9) 21.5
Cost efficiency ratio ................... 33.3 27.2 46.9 44.5 189.0 38.2
US$m US$m US$m US$m US$m US$m
Selected balance sheet data2
Loans and advances to
customers (net) ....................... 34,318 20,292 23,712 3,107 1,779 83,208
Total assets ................................. 52,798 25,625 133,005 7,621 16,327 235,376
Customer accounts ...................... 105,801 37,417 21,070 9,216 222 173,726
The following assets and
liabilities were significant
to Corporate, Investment
Banking and Markets:
– loans and advances to
banks (net) .......................... 39,164
– trading assets, financial
instruments designated at
fair value, and financial
investments ......................... 63,813
– deposits by banks ............... 4,373