HSBC 2006 Annual Report Download - page 50
Download and view the complete annual report
Please find page 50 of the 2006 HSBC annual report below. You can navigate through the pages in the report by either clicking on the pages listed below, or by using the keyword search tool below to find specific information within the annual report.-
 1
1 -
2
-
3
-
4
-
5
-
6
-
7
-
8
-
9
-
10
-
11
-
12
-
13
-
14
-
15
-
16
-
17
-
18
-
19
-
20
-
21
-
22
-
23
-
24
-
25
-
26
-
27
-
28
-
29
-
30
-
31
-
32
-
33
-
34
-
35
-
36
-
37
-
38
-
39
-
 40
40 -
 41
41 -
 42
42 -
 43
43 -
 44
44 -
 45
45 -
 46
46 -
 47
47 -
 48
48 -
 49
49 -
 50
50 -
 51
51 -
 52
52 -
 53
53 -
 54
54 -
 55
55 -
 56
56 -
 57
57 -
 58
58 -
 59
59 -
 60
60 -
61
-
62
-
63
-
64
-
65
-
66
-
67
-
68
-
69
-
70
-
71
-
72
-
73
-
74
-
75
-
76
-
77
-
78
-
79
-
80
-
81
-
82
-
83
-
84
-
85
-
86
-
87
-
88
-
89
-
90
-
91
-
92
-
93
-
94
-
95
-
96
-
97
-
98
-
99
-
100
-
101
-
102
-
103
-
104
-
105
-
106
-
107
-
108
-
109
-
110
-
111
-
112
-
113
-
114
-
115
-
116
-
117
-
118
-
119
-
120
-
121
-
122
-
123
-
124
-
125
-
126
-
127
-
128
-
129
-
130
-
131
-
132
-
133
-
134
-
135
-
136
-
137
-
138
-
139
-
140
-
141
-
142
-
143
-
144
-
145
-
146
-
147
-
148
-
149
-
150
-
151
-
152
-
153
-
154
-
155
-
156
-
157
-
158
-
159
-
160
-
161
-
162
-
163
-
164
-
165
-
166
-
167
-
168
-
169
-
170
-
171
-
172
-
173
-
174
-
175
-
176
-
177
-
178
-
179
-
180
-
181
-
182
-
183
-
184
-
185
-
186
-
187
-
188
-
189
-
190
-
191
-
192
-
193
-
194
-
195
-
196
-
197
-
198
-
199
-
200
-
201
-
202
-
203
-
204
-
205
-
206
-
207
-
208
-
209
-
210
-
211
-
212
-
213
-
214
-
215
-
216
-
217
-
218
-
219
-
220
-
221
-
222
-
223
-
224
-
225
-
226
-
227
-
228
-
229
-
230
-
231
-
232
-
233
-
234
-
235
-
236
-
237
-
238
-
239
-
240
-
241
-
242
-
243
-
244
-
245
-
246
-
247
-
248
-
249
-
250
-
251
-
252
-
253
-
254
-
255
-
256
-
257
-
258
-
259
-
260
-
261
-
262
-
263
-
264
-
265
-
266
-
267
-
268
-
269
-
270
-
271
-
272
-
273
-
274
-
275
-
276
-
277
-
278
-
279
-
280
-
281
-
282
-
283
-
284
-
285
-
286
-
287
-
288
-
289
-
290
-
291
-
292
-
293
-
294
-
295
-
296
-
297
-
298
-
299
-
300
-
301
-
302
-
303
-
304
-
305
-
306
-
307
-
308
-
309
-
310
-
311
-
312
-
313
-
314
-
315
-
316
-
317
-
318
-
319
-
320
-
321
-
322
-
323
-
324
-
325
-
326
-
327
-
328
-
329
-
330
-
331
-
332
-
333
-
334
-
335
-
336
-
337
-
338
-
339
-
340
-
341
-
342
-
343
-
344
-
345
-
346
-
347
-
348
-
349
-
350
-
351
-
352
-
353
-
354
-
355
-
356
-
357
-
358
-
359
-
360
-
361
-
362
-
363
-
364
-
365
-
366
-
367
-
368
-
369
-
370
-
371
-
372
-
373
-
374
-
375
-
376
-
377
-
378
-
379
-
380
-
381
-
382
-
383
-
384
-
385
-
386
-
387
-
388
-
389
-
390
-
391
-
392
-
393
-
394
-
395
-
396
-
397
-
398
-
399
-
400
-
401
-
402
-
403
-
404
-
405
-
406
-
407
-
408
-
409
-
410
-
411
-
412
-
413
-
414
-
415
-
416
-
417
-
418
-
419
-
420
-
421
-
422
-
423
-
424
-
425
-
426
-
427
-
428
-
429
-
430
-
431
-
432
-
433
-
434
-
435
-
436
-
437
-
438
-
439
-
440
-
441
-
442
-
443
-
444
-
445
-
446
-
447
-
448
-
449
-
450
-
451
-
452
-
453
-
454
-
455
-
456
-
457
-
458
 |
 |

HSBC HOLDINGS PLC
Report of the Directors: Business Review (continued)
Hong Kong > 2006
48
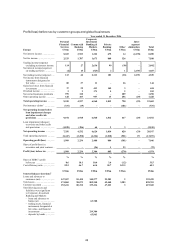
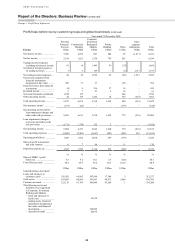
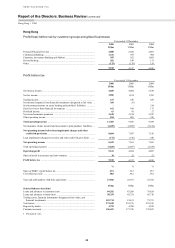
Hong Kong
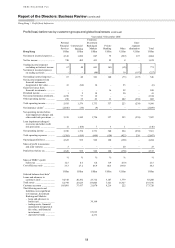
Profit/(loss) before tax by customer groups and global businesses
Year ended 31 December
2006
US$m
2005
US$m
2004
US$m
Personal Financial Services ............................................................................. 2,880 2,628 2,063
Commercial Banking ....................................................................................... 1,321 955 904
Corporate, Investment Banking and Markets .................................................. 955 922 1,603
Private Banking ............................................................................................... 201 190 131
Other ................................................................................................................. (175) (178) 129
5,182 4,517 4,830
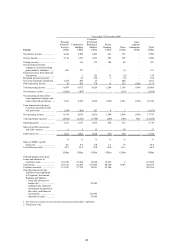
Profit before tax
Year ended 31 December
2006
US$m
2005
US$m
2004
US$m
Net interest income .......................................................................................... 4,685 4,064 3,638
Net fee income ................................................................................................. 2,056 1,674 1,703
Trading income ................................................................................................ 617 546 659
Net income/(expense) from financial instruments designated at fair value ... 260 (6) –
Net investment income on assets backing policyholders’ liabilities .............. – – 314
Gains less losses from financial investments .................................................. 162 108 175
Dividend income .............................................................................................. 61 41 27
Net earned insurance premiums ...................................................................... 2,628 2,334 2,247
Other operating income ................................................................................... 834 805 536
Total operating income ................................................................................. 11,303 9,566 9,299
Net insurance claims incurred and movement in policyholders’ liabilities .... (2,699) (2,059) (2,154)
Net operating income before loan impairment charges and other
credit risk provisions ................................................................................. 8,604 7,507 7,145
Loan impairment (charges)/recoveries and other credit risk provisions ........ (172) (146) 220
Net operating income .................................................................................... 8,432 7,361 7,365
Total operating expenses ................................................................................. (3,269) (2,867) (2,558)
Operating profit ............................................................................................. 5,163 4,494 4,807
Share of profit in associates and joint ventures ............................................... 19 23 23
Profit before tax ............................................................................................. 5,182 4,517 4,830
% % %
Share of HSBC’s profit before tax .................................................................. 23.5 21.5 25.5
Cost efficiency ratio ........................................................................................ 38.0 38.2 35.8
Year-end staff numbers (full-time equivalent) ................................................ 27,586 25,931 25,552
US$m US$m US$m
Selected balance sheet data1
Loans and advances to customers (net) ........................................................... 84,282 83,208 78,824
Loans and advances to banks (net) .................................................................. 50,359 42,751 45,710
Trading assets, financial instruments designated at fair value, and
financial investments ................................................................................... 103,734 81,631 75,721
Total assets ...................................................................................................... 272,428 235,376 225,336
Deposits by banks ............................................................................................ 4,799 4,708 4,325
Customer accounts ........................................................................................... 196,691 173,726 178,033
1 Third party only.