HSBC 2006 Annual Report Download - page 49
Download and view the complete annual report
Please find page 49 of the 2006 HSBC annual report below. You can navigate through the pages in the report by either clicking on the pages listed below, or by using the keyword search tool below to find specific information within the annual report.-
 1
1 -
2
-
3
-
4
-
5
-
6
-
7
-
8
-
9
-
10
-
11
-
12
-
13
-
14
-
15
-
16
-
17
-
18
-
19
-
20
-
21
-
22
-
23
-
24
-
25
-
26
-
27
-
28
-
29
-
30
-
31
-
32
-
33
-
34
-
35
-
36
-
37
-
38
-
 39
39 -
 40
40 -
 41
41 -
 42
42 -
 43
43 -
 44
44 -
 45
45 -
 46
46 -
 47
47 -
 48
48 -
 49
49 -
 50
50 -
 51
51 -
 52
52 -
 53
53 -
 54
54 -
 55
55 -
 56
56 -
 57
57 -
 58
58 -
 59
59 -
60
-
61
-
62
-
63
-
64
-
65
-
66
-
67
-
68
-
69
-
70
-
71
-
72
-
73
-
74
-
75
-
76
-
77
-
78
-
79
-
80
-
81
-
82
-
83
-
84
-
85
-
86
-
87
-
88
-
89
-
90
-
91
-
92
-
93
-
94
-
95
-
96
-
97
-
98
-
99
-
100
-
101
-
102
-
103
-
104
-
105
-
106
-
107
-
108
-
109
-
110
-
111
-
112
-
113
-
114
-
115
-
116
-
117
-
118
-
119
-
120
-
121
-
122
-
123
-
124
-
125
-
126
-
127
-
128
-
129
-
130
-
131
-
132
-
133
-
134
-
135
-
136
-
137
-
138
-
139
-
140
-
141
-
142
-
143
-
144
-
145
-
146
-
147
-
148
-
149
-
150
-
151
-
152
-
153
-
154
-
155
-
156
-
157
-
158
-
159
-
160
-
161
-
162
-
163
-
164
-
165
-
166
-
167
-
168
-
169
-
170
-
171
-
172
-
173
-
174
-
175
-
176
-
177
-
178
-
179
-
180
-
181
-
182
-
183
-
184
-
185
-
186
-
187
-
188
-
189
-
190
-
191
-
192
-
193
-
194
-
195
-
196
-
197
-
198
-
199
-
200
-
201
-
202
-
203
-
204
-
205
-
206
-
207
-
208
-
209
-
210
-
211
-
212
-
213
-
214
-
215
-
216
-
217
-
218
-
219
-
220
-
221
-
222
-
223
-
224
-
225
-
226
-
227
-
228
-
229
-
230
-
231
-
232
-
233
-
234
-
235
-
236
-
237
-
238
-
239
-
240
-
241
-
242
-
243
-
244
-
245
-
246
-
247
-
248
-
249
-
250
-
251
-
252
-
253
-
254
-
255
-
256
-
257
-
258
-
259
-
260
-
261
-
262
-
263
-
264
-
265
-
266
-
267
-
268
-
269
-
270
-
271
-
272
-
273
-
274
-
275
-
276
-
277
-
278
-
279
-
280
-
281
-
282
-
283
-
284
-
285
-
286
-
287
-
288
-
289
-
290
-
291
-
292
-
293
-
294
-
295
-
296
-
297
-
298
-
299
-
300
-
301
-
302
-
303
-
304
-
305
-
306
-
307
-
308
-
309
-
310
-
311
-
312
-
313
-
314
-
315
-
316
-
317
-
318
-
319
-
320
-
321
-
322
-
323
-
324
-
325
-
326
-
327
-
328
-
329
-
330
-
331
-
332
-
333
-
334
-
335
-
336
-
337
-
338
-
339
-
340
-
341
-
342
-
343
-
344
-
345
-
346
-
347
-
348
-
349
-
350
-
351
-
352
-
353
-
354
-
355
-
356
-
357
-
358
-
359
-
360
-
361
-
362
-
363
-
364
-
365
-
366
-
367
-
368
-
369
-
370
-
371
-
372
-
373
-
374
-
375
-
376
-
377
-
378
-
379
-
380
-
381
-
382
-
383
-
384
-
385
-
386
-
387
-
388
-
389
-
390
-
391
-
392
-
393
-
394
-
395
-
396
-
397
-
398
-
399
-
400
-
401
-
402
-
403
-
404
-
405
-
406
-
407
-
408
-
409
-
410
-
411
-
412
-
413
-
414
-
415
-
416
-
417
-
418
-
419
-
420
-
421
-
422
-
423
-
424
-
425
-
426
-
427
-
428
-
429
-
430
-
431
-
432
-
433
-
434
-
435
-
436
-
437
-
438
-
439
-
440
-
441
-
442
-
443
-
444
-
445
-
446
-
447
-
448
-
449
-
450
-
451
-
452
-
453
-
454
-
455
-
456
-
457
-
458
 |
 |

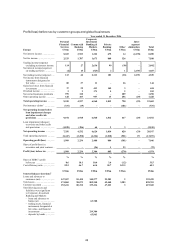
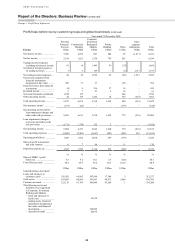
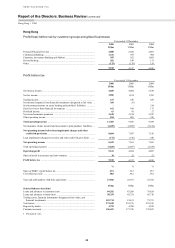
47
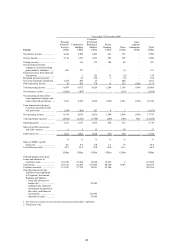
Year ended 31 December 2004
Europe
Personal
Financial
Services
US$m
Commercial
Banking
US$m
Corporate,
Investment
Banking &
Markets
US$m
Private
Banking
US$m
Other
US$m
Inter-
segment
elimination
US$m
Total
US$m
Net interest income ..................... 4,644 2,305 1,403 421 325 – 9,098
Net fee income ............................ 2,110 1,593 1,261 658 358 – 5,980
Trading income ........................... – 116 735 104 42 – 997
Net investment income/
(expense) on assets backing
policyholders’ liabilities ......... 445 127 – – (1) – 571
Gains less losses from financial
investments ............................. – 1 122 33 (2) – 154
Dividend income/(expense) ........ – 36 526 5 (9) – 558
Net earned insurance premiums . 1,254 409 12 – 200 – 1,875
Other operating income .............. 26 285 770 19 255 (180) 1,175
Total operating income ............... 8,479 4,872 4,829 1,240 1,168 (180) 20,408
Net insurance claims1 .................. (1,026) (487) – – (115) – (1,628)
Net operating income before
loan impairment charges and
other credit risk provisions ..... 7,453 4,385 4,829 1,240 1,053 (180) 18,780
Loan impairment (charges)/
recoveries and other credit
risk provisions ........................ (939) (306) 207 4 1 – (1,033)
Net operating income ................. 6,514 4,079 5,036 1,244 1,054 (180) 17,747
Total operating expenses ............ (4,898) (2,422) (3,380) (806) (702) 180 (12,028)
Operating profit .......................... 1,616 1,657 1,656 438 352 – 5,719
Share of profit in associates
and joint ventures ................... 5 6 12 – 14 – 37
Profit before tax .......................... 1,621 1,663 1,668 438 366 – 5,756
% % % % % %
Share of HSBC’s profit
before tax ................................ 8.6 8.8 8.8 2.3 1.9 30.4
Cost efficiency ratio ................... 65.7 55.2 70.0 65.0 66.7 64.0
US$m US$m US$m US$m US$m US$m
Selected balance sheet data2
Loans and advances to
customers (net) ....................... 118,796 67,458 75,628 15,676 2 277,560
Total assets ................................. 143,515 83,289 273,906 40,140 4,707 545,557
Customer accounts ...................... 121,599 57,798 78,031 35,140 – 292,568
The following assets and
liabilities were significant
to Corporate, Investment
Banking and Markets:
– loans and advances to
banks (net) .......................... 47,802
– trading assets, financial
instruments designated at
fair value, and financial
investments ......................... 116,492
– deposits by banks ............... 53,646
1 Net insurance claims incurred and movement in policyholders’ liabilities.
2 Third party only.