HSBC 2006 Annual Report Download - page 118
Download and view the complete annual report
Please find page 118 of the 2006 HSBC annual report below. You can navigate through the pages in the report by either clicking on the pages listed below, or by using the keyword search tool below to find specific information within the annual report.-
 1
1 -
2
-
3
-
4
-
5
-
6
-
7
-
8
-
9
-
10
-
11
-
12
-
13
-
14
-
15
-
16
-
17
-
18
-
19
-
20
-
21
-
22
-
23
-
24
-
25
-
26
-
27
-
28
-
29
-
30
-
31
-
32
-
33
-
34
-
35
-
36
-
37
-
38
-
39
-
40
-
41
-
42
-
43
-
44
-
45
-
46
-
47
-
48
-
49
-
50
-
51
-
52
-
53
-
54
-
55
-
56
-
57
-
58
-
59
-
60
-
61
-
62
-
63
-
64
-
65
-
66
-
67
-
68
-
69
-
70
-
71
-
72
-
73
-
74
-
75
-
76
-
77
-
78
-
79
-
80
-
81
-
82
-
83
-
84
-
85
-
86
-
87
-
88
-
89
-
90
-
91
-
92
-
93
-
94
-
95
-
96
-
97
-
98
-
99
-
100
-
101
-
102
-
103
-
104
-
105
-
106
-
107
-
 108
108 -
 109
109 -
 110
110 -
 111
111 -
 112
112 -
 113
113 -
 114
114 -
 115
115 -
 116
116 -
 117
117 -
 118
118 -
 119
119 -
 120
120 -
 121
121 -
 122
122 -
 123
123 -
 124
124 -
 125
125 -
 126
126 -
 127
127 -
 128
128 -
129
-
130
-
131
-
132
-
133
-
134
-
135
-
136
-
137
-
138
-
139
-
140
-
141
-
142
-
143
-
144
-
145
-
146
-
147
-
148
-
149
-
150
-
151
-
152
-
153
-
154
-
155
-
156
-
157
-
158
-
159
-
160
-
161
-
162
-
163
-
164
-
165
-
166
-
167
-
168
-
169
-
170
-
171
-
172
-
173
-
174
-
175
-
176
-
177
-
178
-
179
-
180
-
181
-
182
-
183
-
184
-
185
-
186
-
187
-
188
-
189
-
190
-
191
-
192
-
193
-
194
-
195
-
196
-
197
-
198
-
199
-
200
-
201
-
202
-
203
-
204
-
205
-
206
-
207
-
208
-
209
-
210
-
211
-
212
-
213
-
214
-
215
-
216
-
217
-
218
-
219
-
220
-
221
-
222
-
223
-
224
-
225
-
226
-
227
-
228
-
229
-
230
-
231
-
232
-
233
-
234
-
235
-
236
-
237
-
238
-
239
-
240
-
241
-
242
-
243
-
244
-
245
-
246
-
247
-
248
-
249
-
250
-
251
-
252
-
253
-
254
-
255
-
256
-
257
-
258
-
259
-
260
-
261
-
262
-
263
-
264
-
265
-
266
-
267
-
268
-
269
-
270
-
271
-
272
-
273
-
274
-
275
-
276
-
277
-
278
-
279
-
280
-
281
-
282
-
283
-
284
-
285
-
286
-
287
-
288
-
289
-
290
-
291
-
292
-
293
-
294
-
295
-
296
-
297
-
298
-
299
-
300
-
301
-
302
-
303
-
304
-
305
-
306
-
307
-
308
-
309
-
310
-
311
-
312
-
313
-
314
-
315
-
316
-
317
-
318
-
319
-
320
-
321
-
322
-
323
-
324
-
325
-
326
-
327
-
328
-
329
-
330
-
331
-
332
-
333
-
334
-
335
-
336
-
337
-
338
-
339
-
340
-
341
-
342
-
343
-
344
-
345
-
346
-
347
-
348
-
349
-
350
-
351
-
352
-
353
-
354
-
355
-
356
-
357
-
358
-
359
-
360
-
361
-
362
-
363
-
364
-
365
-
366
-
367
-
368
-
369
-
370
-
371
-
372
-
373
-
374
-
375
-
376
-
377
-
378
-
379
-
380
-
381
-
382
-
383
-
384
-
385
-
386
-
387
-
388
-
389
-
390
-
391
-
392
-
393
-
394
-
395
-
396
-
397
-
398
-
399
-
400
-
401
-
402
-
403
-
404
-
405
-
406
-
407
-
408
-
409
-
410
-
411
-
412
-
413
-
414
-
415
-
416
-
417
-
418
-
419
-
420
-
421
-
422
-
423
-
424
-
425
-
426
-
427
-
428
-
429
-
430
-
431
-
432
-
433
-
434
-
435
-
436
-
437
-
438
-
439
-
440
-
441
-
442
-
443
-
444
-
445
-
446
-
447
-
448
-
449
-
450
-
451
-
452
-
453
-
454
-
455
-
456
-
457
-
458
 |
 |

HSBC HOLDINGS PLC
Report of the Directors: Financial Review (continued)
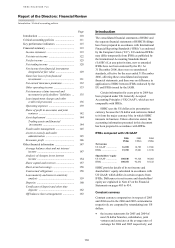
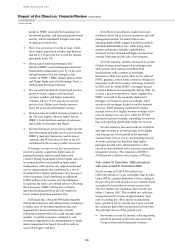
Key performance indicators
116
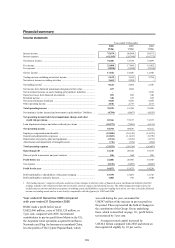
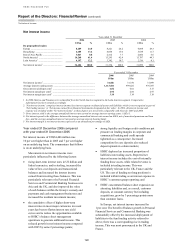
Financial KPIs used by HSBC’s management
2006 2005 200410
% % %
Revenue growth1 ........................ 13.4 12.2 –
Revenue mix2
Net interest income ............... 52.8 54.4 60.6
Net fee income ...................... 26.3 25.1 25.2
Other income3 ........................ 20.9 20.5 14.2
Cost efficiency4 .......................... 51.3 51.2 51.6
Credit performance as measured
by risk adjusted margin5 ........ 6.3 6.3 6.8
Return on average
invested capital6 ..................... 14.9 15.9 15.0
Dividend performance7 .............. 10.1 9.5 5.0
Earnings per share8 (US$) .......... 1.40 1.36 1.18
Over Over Over
1 year 3 years 5 years
Total shareholder return9
HSBC TSR ................................ 104.6 122.0 148.4
Benchmarks:
– FTSE 100 ........................... 114.4 153.8 141.1
– MSCI World ...................... 105.8 139.9 122.4
1 The percentage increase in net operating income before
loan impairment and other credit risk charges since the
previous reporting period.
2 As a percentage of net operating income before loan
impairment charges and other credit risk provisions.
3 Other income comprises net operating income before loan
impairment charges and other credit risk provisions less
net interest income and net fee income.
4 Total operating expenses divided by net operating income
before loan impairment and other credit risk charges.
5 Net operating income divided by average risk-weighted
assets.
6 Profit attributable to ordinary shareholders divided by
average invested capital.
7 The percentage increase in dividend per share since the
previous reporting period.
8 Basic earnings per share is defined in note 12.
9 Total shareholder return is defined on page 281.
10 Presentational changes introduced under IFRSs on
1 January 2005 distort comparison of 2004 data with
succeeding years.
Revenue growth provides an important guide to the
Group’s success in generating business. In 2006,
total revenue grew by 13.4 per cent to
US$65.4 billion, 10.5 per cent on an underlying
basis, reflecting HSBC’s expansion into new
products and markets, improved brand recognition
and refinements in segmentation to better meet
customer needs. The trend maintained the strong
performance in 2005 when the underlying increase
was 11.7 per cent. Higher revenue was largely driven
by balance sheet growth and strong contributions
from emerging markets, where HSBC continued to
introduce products and services developed in mature
economies to these faster growing regions.
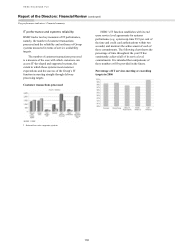
Revenue mix represents the relative distribution
of revenue streams between net interest income, net
fee income and other revenue. It is used to
understand how changing economic factors affect
the Group, to highlight dependence on balance sheet
utilisation for income generation and to indicate
success in cross-selling fee-based services to
customers with loan facilities. This understanding
assists management in making business investment
decisions. Comparison of the revenue mix since
2004 indicates that it has been broadly stable over
recent years. The percentage of revenue attributable
to net interest income fell, however, from 54.4 per
cent in 2005 to 52.8 per cent in 2006 as balance
sheet management revenues were constrained by an
adverse interest rate environment while fee and
trading-based revenue streams have grown more
strongly.
Cost efficiency is a relative measure that
indicates the consumption of resources in generating
revenue. Management uses this metric to assess the
success of technology utilisation and, more
generally, the productivity of the Group’s
distribution platforms and sales forces. The cost
efficiency ratio for 2006 was broadly in line with
the previous two years notwithstanding ongoing
investment in HSBC’s businesses, particularly in
emerging markets, and in improving the Group’s
distribution and technology platforms.
Credit performance as measured by risk-
adjusted margin is an essential gauge for assessing
whether credit is correctly priced so that the returns
available after recognising impairment charges meet
the Group’s required return parameters. The ratio for
2006 was 6.3 per cent, unchanged from 2005,
showing a trend to higher-margin earnings relative to
risk, notwithstanding the significant credit losses in
the mortgage services business in the US described
on page 189. Management aims to improve
risk-adjusted performance over time.
Return on average invested capital measures
the return on the capital investment made in the
business, enabling management to benchmark HSBC
against competitors. In 2006, the ratio of 14.9 per
cent was 100 basis points lower than that reported in
2005. This decline reflected the fact that profitability
grew more slowly than the capital utilised in
generating the profit because of the higher
impairment charges recognised in 2006, largely in
respect of the mortgage services business in the US.
HSBC aims to deliver sustained dividend
performance for its shareholders. The dividend per
share for the year was US$0.76, an increase of
10.1 per cent on 2005, a larger increase than the
9.5 per cent increase in dividend per share reported
in 2005. HSBC has delivered a compound rate of
increase in dividends of 9.6 per cent per annum over
the past 5 years.