HSBC 2006 Annual Report Download - page 353
Download and view the complete annual report
Please find page 353 of the 2006 HSBC annual report below. You can navigate through the pages in the report by either clicking on the pages listed below, or by using the keyword search tool below to find specific information within the annual report.-
 1
1 -
2
-
3
-
4
-
5
-
6
-
7
-
8
-
9
-
10
-
11
-
12
-
13
-
14
-
15
-
16
-
17
-
18
-
19
-
20
-
21
-
22
-
23
-
24
-
25
-
26
-
27
-
28
-
29
-
30
-
31
-
32
-
33
-
34
-
35
-
36
-
37
-
38
-
39
-
40
-
41
-
42
-
43
-
44
-
45
-
46
-
47
-
48
-
49
-
50
-
51
-
52
-
53
-
54
-
55
-
56
-
57
-
58
-
59
-
60
-
61
-
62
-
63
-
64
-
65
-
66
-
67
-
68
-
69
-
70
-
71
-
72
-
73
-
74
-
75
-
76
-
77
-
78
-
79
-
80
-
81
-
82
-
83
-
84
-
85
-
86
-
87
-
88
-
89
-
90
-
91
-
92
-
93
-
94
-
95
-
96
-
97
-
98
-
99
-
100
-
101
-
102
-
103
-
104
-
105
-
106
-
107
-
108
-
109
-
110
-
111
-
112
-
113
-
114
-
115
-
116
-
117
-
118
-
119
-
120
-
121
-
122
-
123
-
124
-
125
-
126
-
127
-
128
-
129
-
130
-
131
-
132
-
133
-
134
-
135
-
136
-
137
-
138
-
139
-
140
-
141
-
142
-
143
-
144
-
145
-
146
-
147
-
148
-
149
-
150
-
151
-
152
-
153
-
154
-
155
-
156
-
157
-
158
-
159
-
160
-
161
-
162
-
163
-
164
-
165
-
166
-
167
-
168
-
169
-
170
-
171
-
172
-
173
-
174
-
175
-
176
-
177
-
178
-
179
-
180
-
181
-
182
-
183
-
184
-
185
-
186
-
187
-
188
-
189
-
190
-
191
-
192
-
193
-
194
-
195
-
196
-
197
-
198
-
199
-
200
-
201
-
202
-
203
-
204
-
205
-
206
-
207
-
208
-
209
-
210
-
211
-
212
-
213
-
214
-
215
-
216
-
217
-
218
-
219
-
220
-
221
-
222
-
223
-
224
-
225
-
226
-
227
-
228
-
229
-
230
-
231
-
232
-
233
-
234
-
235
-
236
-
237
-
238
-
239
-
240
-
241
-
242
-
243
-
244
-
245
-
246
-
247
-
248
-
249
-
250
-
251
-
252
-
253
-
254
-
255
-
256
-
257
-
258
-
259
-
260
-
261
-
262
-
263
-
264
-
265
-
266
-
267
-
268
-
269
-
270
-
271
-
272
-
273
-
274
-
275
-
276
-
277
-
278
-
279
-
280
-
281
-
282
-
283
-
284
-
285
-
286
-
287
-
288
-
289
-
290
-
291
-
292
-
293
-
294
-
295
-
296
-
297
-
298
-
299
-
300
-
301
-
302
-
303
-
304
-
305
-
306
-
307
-
308
-
309
-
310
-
311
-
312
-
313
-
314
-
315
-
316
-
317
-
318
-
319
-
320
-
321
-
322
-
323
-
324
-
325
-
326
-
327
-
328
-
329
-
330
-
331
-
332
-
333
-
334
-
335
-
336
-
337
-
338
-
339
-
340
-
341
-
342
-
 343
343 -
 344
344 -
 345
345 -
 346
346 -
 347
347 -
 348
348 -
 349
349 -
 350
350 -
 351
351 -
 352
352 -
 353
353 -
 354
354 -
 355
355 -
 356
356 -
 357
357 -
 358
358 -
 359
359 -
 360
360 -
 361
361 -
 362
362 -
 363
363 -
364
-
365
-
366
-
367
-
368
-
369
-
370
-
371
-
372
-
373
-
374
-
375
-
376
-
377
-
378
-
379
-
380
-
381
-
382
-
383
-
384
-
385
-
386
-
387
-
388
-
389
-
390
-
391
-
392
-
393
-
394
-
395
-
396
-
397
-
398
-
399
-
400
-
401
-
402
-
403
-
404
-
405
-
406
-
407
-
408
-
409
-
410
-
411
-
412
-
413
-
414
-
415
-
416
-
417
-
418
-
419
-
420
-
421
-
422
-
423
-
424
-
425
-
426
-
427
-
428
-
429
-
430
-
431
-
432
-
433
-
434
-
435
-
436
-
437
-
438
-
439
-
440
-
441
-
442
-
443
-
444
-
445
-
446
-
447
-
448
-
449
-
450
-
451
-
452
-
453
-
454
-
455
-
456
-
457
-
458
 |
 |

351
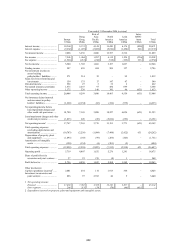
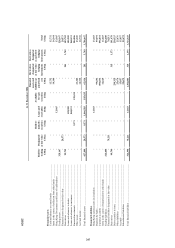
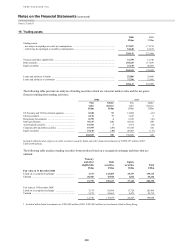
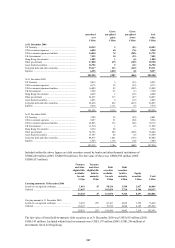
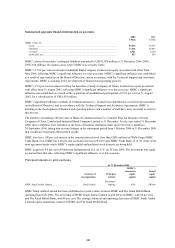
The following table summarises HSBC’s trading portfolios by valuation methodology:
Assets Liabilities
Trading
securities Derivatives
Trading
securities –
short positions
Derivatives
% % % %
At 31 December 2006
Fair value based on:
Quoted market prices ................................................ 82.2 1.9 93.2 2.6
Internal models with significant observable
market parameters ................................................ 17.8 96.3 6.8 96.5
Internal models with significant unobservable
market parameters ................................................ – 1.8 – 0.9
100.0 100.0 100.0 100.0
At 31 December 2005
Fair value based on:
Quoted market prices ................................................ 87.6 6.0 96.0 5.7
Internal models with significant observable
market parameters ................................................ 12.4 91.5 4.0 92.4
Internal models with significant unobservable
market parameters ................................................ – 2.5 – 1.9
100.0 100.0 100.0 100.0
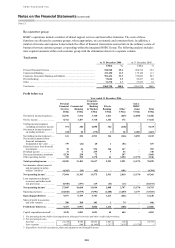
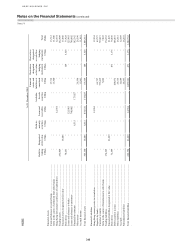
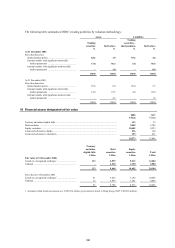
16 Financial assets designated at fair value
2006 2005
US$m US$m
Treasury and other eligible bills ........................................................................................................ 133 53
Debt securities ................................................................................................................................... 9,449 5,705
Equity securities ................................................................................................................................. 10,602 8,533
Loans and advances to banks ............................................................................................................ 236 124
Loans and advances to customers ...................................................................................................... 153 631
20,573 15,046
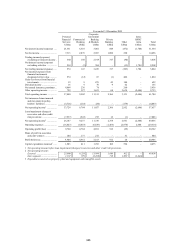
Treasury
and other
eligible bills
Debt
securities
Equity
securities
Total
US$m US$m US$m US$m
Fair value at 31 December 2006
Listed on a recognised exchange1 ................................. 133 4,939 9,212 14,284
Unlisted ......................................................................... – 4,510 1,390 5,900
133 9,449 10,602 20,184
Fair value at 31 December 2005
Listed on a recognised exchange1 ................................. 41 3,012 7,192 10,245
Unlisted ......................................................................... 12 2,693 1,341 4,046
53 5,705 8,533 14,291
1 Included within listed investments are US$1,014 million of investments listed in Hong Kong (2005: US$932 million).