Entergy 2002 Annual Report Download - page 80
Download and view the complete annual report
Please find page 80 of the 2002 Entergy annual report below. You can navigate through the pages in the report by either clicking on the pages listed below, or by using the keyword search tool below to find specific information within the annual report.-
 1
1 -
2
-
3
-
4
-
5
-
6
-
7
-
8
-
9
-
10
-
11
-
12
-
13
-
14
-
15
-
16
-
17
-
18
-
19
-
20
-
21
-
22
-
23
-
24
-
25
-
26
-
27
-
28
-
29
-
30
-
31
-
32
-
33
-
34
-
35
-
36
-
37
-
38
-
39
-
40
-
41
-
42
-
43
-
44
-
45
-
46
-
47
-
48
-
49
-
50
-
51
-
52
-
53
-
54
-
55
-
56
-
57
-
58
-
59
-
60
-
61
-
62
-
63
-
64
-
65
-
66
-
67
-
68
-
69
-
 70
70 -
 71
71 -
 72
72 -
 73
73 -
 74
74 -
 75
75 -
 76
76 -
 77
77 -
 78
78 -
 79
79 -
 80
80 -
 81
81 -
 82
82 -
 83
83 -
 84
84
 |
 |

Other Derivatives
Entergy also holds derivative instruments such as natural gas
and electricity options and forwards that are not accounted for
as hedges. These instruments are entered into to optimize
asset values or limit risks.
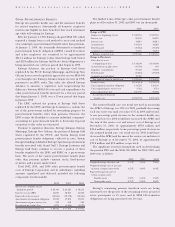
Fair Values
COMMODITY INSTRUMENTS – Fair value estimates of Energy
Commodity Services’ commodity instruments are made at
discrete points in time based on relevant market information.
Market quotes are used in determining fair value whenever
they are available. When market quotes are not available (e.g.,
in the case of a long-dated commodity contract), other
information is used, including transactional data and internally
developed models. Fair value estimates based on these other
methodologies are necessarily subjective in nature and involve
uncertainties and matters of significant judgment. Therefore,
actual results may differ from these estimates. At December 31,
2002 and 2001, the fair values of Energy Commodity Services’
energy-related commodity contracts accounted for on a mark-
to-market basis were as follows (in thousands):
2002 2001
Assets Liabilities Assets Liabilities
Consolidated
subsidiaries $ 4,071 $ 8,395 $ 59,996 $ 18,882
Equity method
investees(1) $754,678 $663,765 $774,509 $667,752
(1) As required by equity method accounting principles, only Entergy’s net
investment in these investees is reflected in its balance sheet, and these assets
and liabilities are not reflected in Entergy’s balance sheet. See Note 13 to the
consolidated financial statements for more information on Entergy’s equity
method investees.
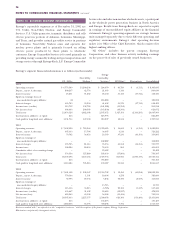
Following are the cumulative periods in which the net mark-
to-market assets would be realized in cash if they are held to
maturity and market prices are unchanged (in millions):
Maturities and Sources
for Fair Value of Trading 2005-
Contracts at December 31, 2002 2003 2004 2006 Total
Prices actively quoted $45.0 $45.1 $(20.2) $69.9
Prices provided by
other sources 24.4 3.3 1.9 29.6
Prices based on models (13.3) 1.3 3.4 (8.6)
Total $56.1 $49.7 $(14.9) $90.9
FINANCIAL INSTRUMENTS –The estimated fair value of Entergy’s
financial instruments is determined using bid prices reported by
dealer markets and by nationally recognized investment
banking firms. The estimated fair value of derivative financial
instruments is based on market quotes. Considerable judgment
is required in developing some of the estimates of fair value.
Therefore, estimates are not necessarily indicative of the
amounts that Entergy could realize in a current market
exchange. In addition, gains or losses realized on financial
instruments held by regulated businesses may be reflected in
future rates and therefore do not necessarily accrue to the
benefit or detriment of stockholders.
Entergy considers the carrying amounts of most of its financial
instruments classified as current assets and liabilities to be a
reasonable estimate of their fair value because of the short
maturity of these instruments. Additional information regarding
financial instruments and their fair values is included in Notes 5,
6, and 7 to the consolidated financial statements.
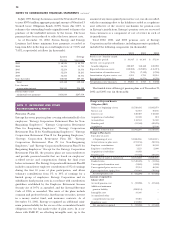
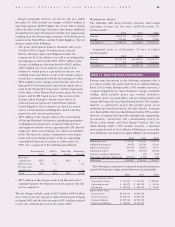
NOTE 16. QUARTERLY FINANCIAL DATA
(UNAUDITED)
Operating results for the four quarters of 2002 and 2001 were
(in thousands):
Operating Operating Net Income
Revenues Income (Loss) (Loss)
2002:
First Quarter $1,860,834 $(45,675) $(72,983)
Second Quarter 2,096,581 496,154 247,585
Third Quarter 2,468,875 663,689 366,800
Fourth Quarter 1,878,745 73,512 81,670
2001:
First Quarter $2,652,427 $360,967 $160,871
Second Quarter 2,506,275 480,549 245,583
Third Quarter 2,576,889 607,656 317,454
Fourth Quarter 1,885,308 124,170 26,599(a)
(a) Net income before cumulative effect of accounting change for the fourth
quarter of 2001 was $3,117.
EARNINGS PER AVERAGE COMMON SHARE
2002 2001
Basic Diluted Basic Diluted
First Quarter $(0.36) $(0.36) $0.70 $0.69
Second Quarter $ 1.08 $ 1.06 $1.08 $1.06
Third Quarter $ 1.61 $ 1.59 $1.41 $1.39
Fourth Quarter $ 0.36 $ 0.35 $0.10(b) $0.09(b)
(b) Basic and diluted earnings per average common share before the cumulative
effect of accounting change for the fourth quarter of 2001 was ($0.01).
78
NOTES TO CONSOLIDATED FINANCIAL STATEMENTS concluded