Entergy 2002 Annual Report Download - page 25
Download and view the complete annual report
Please find page 25 of the 2002 Entergy annual report below. You can navigate through the pages in the report by either clicking on the pages listed below, or by using the keyword search tool below to find specific information within the annual report.-
 1
1 -
2
-
3
-
4
-
5
-
6
-
7
-
8
-
9
-
10
-
11
-
12
-
13
-
14
-
 15
15 -
 16
16 -
 17
17 -
 18
18 -
 19
19 -
 20
20 -
 21
21 -
 22
22 -
 23
23 -
 24
24 -
 25
25 -
 26
26 -
 27
27 -
 28
28 -
 29
29 -
 30
30 -
 31
31 -
 32
32 -
 33
33 -
 34
34 -
 35
35 -
36
-
37
-
38
-
39
-
40
-
41
-
42
-
43
-
44
-
45
-
46
-
47
-
48
-
49
-
50
-
51
-
52
-
53
-
54
-
55
-
56
-
57
-
58
-
59
-
60
-
61
-
62
-
63
-
64
-
65
-
66
-
67
-
68
-
69
-
70
-
71
-
72
-
73
-
74
-
75
-
76
-
77
-
78
-
79
-
80
-
81
-
82
-
83
-
84
 |
 |

Entergy Corporation is an investor-owned public utility holding
company that operates primarily through three business segments.
U.S. UTILITY generates, transmits, distributes, and
sells electric power, with a small amount of natural
gas distribution.
NON-UTILITY NUCLEAR owns and operates five nuclear
power plants and is primarily focused on selling electric
power produced by those plants to wholesale customers.
ENERGY COMMODITY SERVICES is focused almost exclusively
on providing energy commodity trading and gas trans-
portation and storage services through Entergy-Koch, LP.
Energy Commodity Services also includes Entergy’s non-
nuclear wholesale assets business.
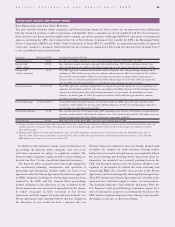
Following are the percentages of Entergy’s consolidated
revenues and net income generated by these segments and the
percentage of total assets held by them:
% of Revenue
Segment 2002 2001 2000
U.S. Utility 82 77 74
Non-Utility Nuclear 14 8 3
Energy Commodity Services 4 14 23
Parent & Other – 1 –
% of Net Income
Segment 2002(1) 2001 2000
U.S. Utility 97 77 87
Non-Utility Nuclear 32 17 7
Energy Commodity Services (23) 14 8
Parent & Other (6) (8) (2)
% of Total Assets
Segment 2002 2001 2000
U.S. Utility 78 78 81
Non-Utility Nuclear 17 13 9
Energy Commodity Services 8 9 10
Parent & Other (3) – –
(1) The net income figures in 2002 include a $238 million net of tax charge in
the Energy Commodity Services segment. If this charge were excluded, the
percentages would be 70% for U.S. Utility, 23% for Non-Utility Nuclear,
11% for Energy Commodity Services, and (4%) for Parent & Other.
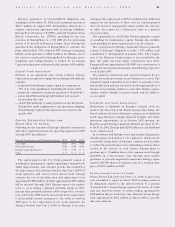
RESULTS OF OPERATIONS
Earnings applicable to common stock for the years ended
December 31, 2002, 2001, and 2000 by operating segment are
as follows (in thousands):
Operating Segment 2002 2001 2000
U.S. Utility $ 583,251 $ 550,243 $ 586,642
Non-Utility Nuclear 200,505 127,880 49,158
Energy Commodity Services (145,830) 105,939 54,908
Parent & Other (38,566) (57,866) (11,414)
Total $ 599,360 $ 726,196 $ 679,294
Results for 2002 were negatively affected by net charges
($238.3 million after-tax) reflecting the effect of Entergy’s
decision to discontinue additional greenfield power plant
development and asset impairments resulting from the deteri-
orating economics of wholesale power markets principally in
the United States and the United Kingdom. The net charges
are discussed more fully below in the Energy Commodity
Services discussion.
Entergy’s income before taxes is discussed according to the
business segments listed above. See Note 12 to the consolidated
financial statements for further discussion of Entergy’s business
segments and their financial results in 2002, 2001, and 2000.
U.S. UTILITY
The increase in earnings for the U.S. Utility in 2002 from
$550 million to $583 million was primarily due to a decrease
in interest charges combined with an increase in other
income, partially offset by decreases in operating income and
interest income.
The decrease in earnings for the U.S. Utility in 2001 from
$587 million to $550 million was primarily due to a decrease in
operating income and increased interest charges, partially
offset by an increase in interest income.
Operating Income
2002 Compared to 2001
Operating income decreased by $43.6 million in 2002 primarily
due to:
an increase in other operation and maintenance expenses
of $273.2 million. $159.9 million of this increase is offset
in other regulatory credits and relates to a March 2002
settlement agreement and 2001 earnings review that
became final in the second quarter of 2002, allowing
Entergy Arkansas to recover a large majority of 2000
and 2001 ice storm repair expenses through previously-
collected transition cost account (TCA) amounts (the
remaining increase in other operation and maintenance
expenses is explained below); and
MANAGEMENT’S FINANCIAL DISCUSSION AND ANALYSIS
ENTERGY CORPORATION AND SUBSIDIARIES 2002 23