Entergy 2002 Annual Report Download - page 32
Download and view the complete annual report
Please find page 32 of the 2002 Entergy annual report below. You can navigate through the pages in the report by either clicking on the pages listed below, or by using the keyword search tool below to find specific information within the annual report.-
 1
1 -
2
-
3
-
4
-
5
-
6
-
7
-
8
-
9
-
10
-
11
-
12
-
13
-
14
-
15
-
16
-
17
-
18
-
19
-
20
-
21
-
 22
22 -
 23
23 -
 24
24 -
 25
25 -
 26
26 -
 27
27 -
 28
28 -
 29
29 -
 30
30 -
 31
31 -
 32
32 -
 33
33 -
 34
34 -
 35
35 -
 36
36 -
 37
37 -
 38
38 -
 39
39 -
 40
40 -
 41
41 -
 42
42 -
43
-
44
-
45
-
46
-
47
-
48
-
49
-
50
-
51
-
52
-
53
-
54
-
55
-
56
-
57
-
58
-
59
-
60
-
61
-
62
-
63
-
64
-
65
-
66
-
67
-
68
-
69
-
70
-
71
-
72
-
73
-
74
-
75
-
76
-
77
-
78
-
79
-
80
-
81
-
82
-
83
-
84
 |
 |

Public Utility Holding Company Act of 1935 (PUHCA)
Restrictions on Uses of Capital
Entergy’s ability to invest in domestic and foreign generation
businesses is subject to Securities and Exchange Commission
(SEC) regulations under PUHCA. As authorized by the SEC,
Entergy is allowed to invest an amount equal to 100% of
its average consolidated retained earnings in domestic and
foreign generation businesses. As of December 31, 2002,
Entergy’s investments subject to this rule totaled $1.97 billion
constituting 52.5% of Entergy’s average consolidated retained
earnings.
Entergy’s ability to guarantee obligations of Entergy’s non-
utility subsidiaries is also limited by the SEC’s regulations
under PUHCA. In August 2000, the SEC issued an order,
effective through December 31, 2005, that allows Entergy to
issue up to $2 billion of guarantees for the benefit of its non-
utility companies.
Under PUHCA, the SEC imposes a limit equal to 15% of con-
solidated capitalization on the amount that may be invested in
“energy-related” businesses without specific SEC approval.
Entergy has made investments in energy-related businesses,
including power marketing and trading. Entergy’s available
capacity to make additional investments at December 31, 2002,
was approximately $1.8 billion.
SOURCES OF CAPITAL
Entergy’s sources to meet its capital requirements and to fund
potential investments include:
internally generated funds, which have been the source of
the majority of Entergy’s capital;
cash on hand ($1.3 billion as of December 31, 2002);
securities issuances;
bank financing under new or existing facilities; and
sales of assets.
The majority of Entergy’s internally generated funds come
from the domestic utility companies and System Energy.
Circumstances such as weather patterns, price fluctuations,
and unanticipated expenses, including unscheduled plant
outages, could affect the level of internally generated funds
in the future. In the following section Entergy’s cash flow
activity for the previous three years is discussed.
Provisions within the Articles of Incorporation or pertinent
indentures and various other agreements relating to the long-
term debt and preferred stock of certain of Entergy
Corporation’s subsidiaries restrict the payment of cash
dividends or other distributions on their common and
preferred stock. As of December 31, 2002, Entergy Arkansas
and Entergy Mississippi had restricted retained earnings
unavailable for distribution to Entergy Corporation of
$296.1 million and $36.2 million, respectively. Additionally,
PUHCA prohibits Entergy Corporation’s subsidiaries from
making loans or advances to Entergy Corporation.
Short-term borrowings by the domestic utility companies
and System Energy, including borrowings under the intra-
company money pool, are limited to amounts authorized by
the SEC. Under the SEC order authorizing the short-term
borrowing limits, the domestic utility companies and System
Energy cannot incur new short-term indebtedness if the
issuer’s common equity would comprise less than 30% of
its capital. In addition, this order restricts Entergy Gulf
States, Entergy Louisiana, Entergy Mississippi, or System
Energy from issuing long-term debt unless that debt will
be rated as investment grade. See Note 4 to the consoli-
dated financial statements for further discussion of Entergy’s
short-term borrowing limits.
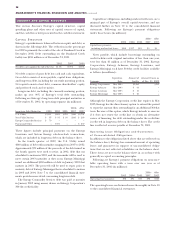
CASH FLOW ACTIVITY
As shown in Entergy’s Statements of Cash Flows, cash flows
for the years ended December 31, 2002, 2001, and 2000 were
as follows (in millions):
2002 2001 2000
Cash and cash equivalents
at beginning of period $ 752 $ 1,382 $ 1,214
Cash flow provided by (used in):
Operating activities 2,181 2,216 1,968
Investing activities (1,388) (2,224) (1,814)
Financing activities (213) (622) 20
Effect of exchange rates on
cash and cash equivalents 3 – (6)
Net increase (decrease) in cash
and cash equivalents 583 (630) 168
Cash and cash equivalents
at end of period $ 1,335 $ 752 $ 1,382
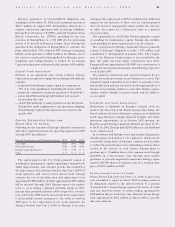
Operating Cash Flow Activity
2002 Compared to 2001
Entergy’s cash flow provided by operating activities decreased
slightly in 2002 primarily due to the following:
The U.S. Utility provided $2,341 million in operating cash
flow, an increase of $693 million compared to 2001. The
increase primarily resulted from the tax accounting election
made by Entergy Louisiana that is discussed below.
The parent company used $439 million in operating cash
flow, compared to providing $407 million in 2001. The
decrease primarily resulted from the payment that Entergy
Corporation made to Entergy Louisiana pursuant to the
tax accounting election made by Entergy Louisiana that
is discussed below.
The Non-Utility Nuclear business provided $282 million in
operating cash flow, an increase of $18 million compared
to 2001.
Entergy’s investment in Entergy-Koch used $47 million in
operating cash flow in 2002, a decrease of $8 million
compared to 2001. The use of cash primarily relates to
tax payments on Entergy’s share of the partnership income.
Entergy did not receive a dividend from Entergy-Koch in
2002 or in 2001 because the joint venture is retaining
capital for business opportunities.
The non-nuclear wholesale asset business provided
$43 million in operating cash flow in 2002, compared
to using $73 million in 2001.
MANAGEMENT’S FINANCIAL DISCUSSION AND ANALYSIS continued
30