Entergy 2002 Annual Report Download - page 65
Download and view the complete annual report
Please find page 65 of the 2002 Entergy annual report below. You can navigate through the pages in the report by either clicking on the pages listed below, or by using the keyword search tool below to find specific information within the annual report.-
 1
1 -
2
-
3
-
4
-
5
-
6
-
7
-
8
-
9
-
10
-
11
-
12
-
13
-
14
-
15
-
16
-
17
-
18
-
19
-
20
-
21
-
22
-
23
-
24
-
25
-
26
-
27
-
28
-
29
-
30
-
31
-
32
-
33
-
34
-
35
-
36
-
37
-
38
-
39
-
40
-
41
-
42
-
43
-
44
-
45
-
46
-
47
-
48
-
49
-
50
-
51
-
52
-
53
-
54
-
 55
55 -
 56
56 -
 57
57 -
 58
58 -
 59
59 -
 60
60 -
 61
61 -
 62
62 -
 63
63 -
 64
64 -
 65
65 -
 66
66 -
 67
67 -
 68
68 -
 69
69 -
 70
70 -
 71
71 -
 72
72 -
 73
73 -
 74
74 -
 75
75 -
76
-
77
-
78
-
79
-
80
-
81
-
82
-
83
-
84
 |
 |

Entergy Corporation reissues treasury shares to meet the
requirements of the Stock Plan for Outside Directors
(Directors’ Plan), the Equity Ownership Plan of Entergy
Corporation and Subsidiaries (Equity Ownership Plan), the
Equity Awards Plan, and certain other stock benefit plans.
The Directors’ Plan awards to non-employee directors a portion
of their compensation in the form of a fixed number of shares
of Entergy Corporation common stock.
Equity Compensation Plan Information
Entergy has two plans that grant stock options, equity awards,
and incentive awards to key employees of the Entergy
subsidiaries. The Equity Ownership Plan is a shareholder-
approved stock-based compensation plan. The Equity Awards
Plan is a Board-approved stock-based compensation plan. Stock
options are granted at exercise prices not less than market value
on the date of grant. The majority of options granted in 2002,
2001, and 2000 will become exercisable in equal amounts on
each of the first three anniversaries of the date of grant. Options
are forfeited if they are not exercised within ten years from the
date of the grant.
Beginning in 2001, Entergy began granting most of the equity
awards and incentive awards earned under its stock benefit
plans in the form of performance units, which are equal to the
cash value of shares of Entergy Corporation common stock at
the time of payment. In addition to the potential for equivalent
share appreciation or depreciation, performance units will
earn the cash equivalent of the dividends paid during the
performance period applicable to each plan. The amount of
performance units awarded will not reduce the amount of secu-
rities remaining under the current authorizations. The costs of
equity and incentive awards, given either as company stock or
performance units, are charged to income over the period of
the grant or restricted period, as appropriate. In 2002, 2001,
and 2000, $28 million, $14 million, and $17 million, respectively,
was charged to compensation expense.
The fair value of each option grant is estimated on the date
of grant using the Black-Scholes option-pricing model with the
following stock option weighted-average assumptions:
2002 2001 2000
Stock price volatility 27.2% 26.3% 24.4%
Expected term in years 5 5 5
Risk-free interest rate 4.2% 4.9% 6.6%
Dividend yield 3.2% 3.4% 5.2%
Dividend payment $1.32 $1.26 $1.20
ENTERGY CORPORATION AND SUBSIDIARIES 2002 63
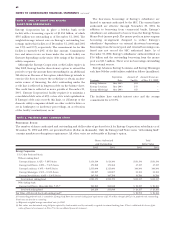
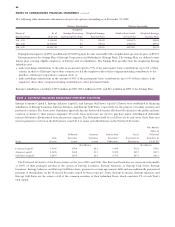
COMMON STOCK
Treasury stock activity for Entergy for 2002 and 2001 was as follows (dollars in thousands):
2002 2001
Treasury Shares Cost Treasury Shares Cost
Beginning Balance, January 1 27,441,384 $ 758,820 28,490,031 $ 774,905
Repurchases 2,885,000 118,499 989,100 36,895
Transfers – – 361,720 10,711
Issuances:
Equity Ownership/Equity Awards Plans (4,567,054) (129,748) (2,393,177) (63,519)
Directors’ Plan (6,920) (240) (6,290) (172)
Ending Balance, December 31 25,752,410 $ 747,331 27,441,384 $ 758,820
Stock option transactions are summarized as follows:
2002 2001 2000
Number of Average Number of Average Number of Average
Options Exercise Price Options Exercise Price Options Exercise Price
Beginning-of-year balance 17,316,816 $31.06 11,468,316 $25.52 5,493,882 $29.48
Options granted 8,168,025 41.72 8,602,300 36.96 7,219,134 22.98
Options exercised (4,877,688) 28.62 (2,407,783) 25.85 (920,077) 28.26
Options forfeited (664,039) 36.36 (346,017) 30.35 (324,623) 28.29
End-of-year balance 19,943,114 $35.85 17,316,816 $31.06 11,468,316 $25.52
Options exercisable at year-end 4,837,511 $31.39 2,923,452 $27.35 1,641,062 $29.38
Weighted-average fair value of
options at time of grant $9.22 $8.14 $4.30