Entergy 2002 Annual Report Download - page 24
Download and view the complete annual report
Please find page 24 of the 2002 Entergy annual report below. You can navigate through the pages in the report by either clicking on the pages listed below, or by using the keyword search tool below to find specific information within the annual report.-
 1
1 -
2
-
3
-
4
-
5
-
6
-
7
-
8
-
9
-
10
-
11
-
12
-
13
-
 14
14 -
 15
15 -
 16
16 -
 17
17 -
 18
18 -
 19
19 -
 20
20 -
 21
21 -
 22
22 -
 23
23 -
 24
24 -
 25
25 -
 26
26 -
 27
27 -
 28
28 -
 29
29 -
 30
30 -
 31
31 -
 32
32 -
 33
33 -
 34
34 -
35
-
36
-
37
-
38
-
39
-
40
-
41
-
42
-
43
-
44
-
45
-
46
-
47
-
48
-
49
-
50
-
51
-
52
-
53
-
54
-
55
-
56
-
57
-
58
-
59
-
60
-
61
-
62
-
63
-
64
-
65
-
66
-
67
-
68
-
69
-
70
-
71
-
72
-
73
-
74
-
75
-
76
-
77
-
78
-
79
-
80
-
81
-
82
-
83
-
84
 |
 |

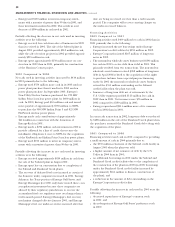
In thousands, except percentages and per share amounts 2002 2001 2000 1999 1998(a)
SELECTED FINANCIAL DATA AS REPORTED:
Operating revenues $8,305,035 $ 9,620,899 $ 10,022,129 $ 8,765,635 $ 11,494,772
Income before cumulative effect
of accounting change $623,072 $ 727,025 $ 710,915 $ 595,026 $ 785,629
Earnings per share before cumulative effect
of accounting change
Basic $2.69 $ 3.18 $ 3.00 $ 2.25 $ 3.00
Diluted $2.64 $ 3.13 $ 2.97 $ 2.25 $ 3.00
Dividends declared per share $1.34 $ 1.28 $ 1.22 $ 1.20 $ 1.50
Book value per share, year-end $35.24 $ 33.78 $ 31.89 $ 29.78 $ 28.82
Common shares outstanding:
At year-end 222,422 220,733 219,605 239,037 246,620
Weighted average - basic 223,047 220,944 226,580 245,127 246,396
Weighted average - diluted 227,303 224,734 228,541 245,327 246,572
Total assets $26,947,969 $25,910,311 $ 25,451,896 $ 22,969,940 $ 22,836,694
Long-term obligations(b) $7,482,269 $ 7,743,298 $ 8,214,724 $ 7,252,697 $ 7,349,349
Preferred and preference stock $358,664 $ 360,522 $ 400,446 $ 558,105 $ 655,978
Long-term debt (excluding currently maturing debt) $7,086,999 $ 7,321,028 $ 7,732,093 $ 6,612,583 $ 6,596,617
Return on average common equity 7.85% 10.04% 9.62% 7.77% 10.71%
Cash from operations $2,181,703 $ 2,215,548 $ 1,967,847 $ 1,389,024 $ 1,835,682
DOMESTIC UTILITY ELECTRIC REVENUES:
Residential $2,439,590 $ 2,612,889 $ 2,524,529 $ 2,231,091 $ 2,299,317
Commercial 1,672,964 1,860,040 1,699,699 1,502,267 1,513,050
Industrial 1,850,476 2,298,825 2,177,236 1,878,363 1,829,085
Governmental 179,508 205,054 185,286 163,403 172,368
Total retail 6,142,538 6,976,808 6,586,750 5,775,124 5,813,820
Sales for resale 330,010 395,353 423,519 397,844 448,842
Other 173,866 (127,334) 209,417 98,446 (126,340)
Total $6,646,414 $ 7,244,827 $ 7,219,686 $ 6,271,414 $ 6,136,322
DOMESTIC UTILITY ELECTRIC SALES:
(Millions of KWh)
Residential 32,581 31,080 31,998 30,631 30,935
Commercial 25,354 24,706 24,657 23,775 23,177
Industrial 41,018 41,577 43,956 43,549 43,453
Governmental 2,678 2,593 2,605 2,564 2,659
Total retail 101,631 99,956 103,216 100,519 100,224
Sales for resale 9,828 8,896 9,794 9,714 11,187
Total 111,459 108,852 113,010 110,233 111,411
(a) Includes the effects of the sales of London Electricity and CitiPower in December 1998.
(b) Includes long-term debt (excluding currently maturing debt), preferred stock with sinking fund, preference stock, preferred securities of subsidiary trusts and
partnership, and noncurrent capital lease obligations.
22
FIVE-YEAR SUMMARY OF SELECTED FINANCIAL AND OPERATING DATA