Entergy 2002 Annual Report Download - page 46
Download and view the complete annual report
Please find page 46 of the 2002 Entergy annual report below. You can navigate through the pages in the report by either clicking on the pages listed below, or by using the keyword search tool below to find specific information within the annual report.-
 1
1 -
2
-
3
-
4
-
5
-
6
-
7
-
8
-
9
-
10
-
11
-
12
-
13
-
14
-
15
-
16
-
17
-
18
-
19
-
20
-
21
-
22
-
23
-
24
-
25
-
26
-
27
-
28
-
29
-
30
-
31
-
32
-
33
-
34
-
35
-
 36
36 -
 37
37 -
 38
38 -
 39
39 -
 40
40 -
 41
41 -
 42
42 -
 43
43 -
 44
44 -
 45
45 -
 46
46 -
 47
47 -
 48
48 -
 49
49 -
 50
50 -
 51
51 -
 52
52 -
 53
53 -
 54
54 -
 55
55 -
 56
56 -
57
-
58
-
59
-
60
-
61
-
62
-
63
-
64
-
65
-
66
-
67
-
68
-
69
-
70
-
71
-
72
-
73
-
74
-
75
-
76
-
77
-
78
-
79
-
80
-
81
-
82
-
83
-
84
 |
 |

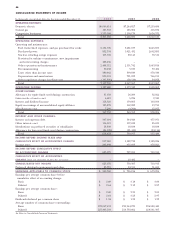
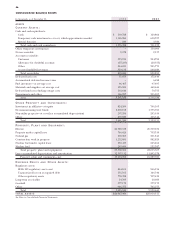
In thousands, except share data, for the years ended December 31, 2002 2001 2000
OPERATING REVENUES:
Domestic electric $6,646,414 $7,244,827 $7,219,686
Natural gas 125,353 185,902 165,872
Competitive businesses 1,533,268 2,190,170 2,636,571
Total 8,305,035 9,620,899 10,022,129
OPERATING EXPENSES:
Operating and maintenance:
Fuel, fuel-related expenses, and gas purchased for resale 2,154,596 3,681,677 2,645,835
Purchased power 832,334 1,021,432 2,662,881
Nuclear refueling outage expenses 105,592 89,145 70,511
Provision for turbine commitments, asset impairments
and restructuring charges 428,456 – –
Other operation and maintenance 2,488,112 2,151,742 1,943,814
Decommissioning 30,458 3,189 39,484
Taxes other than income taxes 380,462 399,849 370,344
Depreciation and amortization 839,181 721,033 746,125
Other regulatory charges (credits)—net (141,836) (20,510) 34,073
Total 7,117,355 8,047,557 8,513,067
OPERATING INCOME 1,187,680 1,573,342 1,509,062
OTHER INCOME:
Allowance for equity funds used during construction 31,658 26,209 32,022
Gain on sale of assets—net 6,612 5,226 2,340
Interest and dividend income 118,325 159,805 163,050
Equity in earnings of unconsolidated equity affiliates 183,878 162,882 13,715
Miscellaneous—net 7,280 (4,769) 27,077
Total 347,753 349,353 238,204
INTEREST AND OTHER CHARGES:
Interest on long-term debt 507,604 544,920 477,071
Other interest—net 116,519 197,638 85,635
Distributions on preferred securities of subsidiaries 18,838 18,838 18,838
Allowance for borrowed funds used during construction (24,538) (21,419) (24,114)
Total 618,423 739,977 557,430
INCOME BEFORE INCOME TAXES AND
CUMULATIVE EFFECT OF ACCOUNTING CHANGE 917,010 1,182,718 1,189,836
Income taxes 293,938 455,693 478,921
INCOME BEFORE CUMULATIVE EFFECT
OF ACCOUNTING CHANGE 623,072 727,025 710,915
CUMULATIVE EFFECT OF ACCOUNTING
CHANGE (NET OF INCOME TAXES OF $10,064)–23,482 –
CONSOLIDATED NET INCOME 623,072 750,507 710,915
Preferred dividend requirements and other 23,712 24,311 31,621
EARNINGS APPLICABLE TO COMMON STOCK $ 599,360 $ 726,196 $ 679,294
Earnings per average common share before
cumulative effect of accounting change:
Basic $ 2.69 $ 3.18 $ 3.00
Diluted $ 2.64 $ 3.13 $ 2.97
Earnings per average common share:
Basic $ 2.69 $ 3.29 $ 3.00
Diluted $ 2.64 $ 3.23 $ 2.97
Dividends declared per common share $ 1.34 $ 1.28 $ 1.22
Average number of common shares outstanding:
Basic 223,047,431 220,944,270 226,580,449
Diluted 227,303,103 224,733,662 228,541,307
See Notes to Consolidated Financial Statements.
CONSOLIDATED STATEMENTS OF INCOME
44