Entergy 2002 Annual Report Download - page 53
Download and view the complete annual report
Please find page 53 of the 2002 Entergy annual report below. You can navigate through the pages in the report by either clicking on the pages listed below, or by using the keyword search tool below to find specific information within the annual report.-
 1
1 -
2
-
3
-
4
-
5
-
6
-
7
-
8
-
9
-
10
-
11
-
12
-
13
-
14
-
15
-
16
-
17
-
18
-
19
-
20
-
21
-
22
-
23
-
24
-
25
-
26
-
27
-
28
-
29
-
30
-
31
-
32
-
33
-
34
-
35
-
36
-
37
-
38
-
39
-
40
-
41
-
42
-
 43
43 -
 44
44 -
 45
45 -
 46
46 -
 47
47 -
 48
48 -
 49
49 -
 50
50 -
 51
51 -
 52
52 -
 53
53 -
 54
54 -
 55
55 -
 56
56 -
 57
57 -
 58
58 -
 59
59 -
 60
60 -
 61
61 -
 62
62 -
 63
63 -
64
-
65
-
66
-
67
-
68
-
69
-
70
-
71
-
72
-
73
-
74
-
75
-
76
-
77
-
78
-
79
-
80
-
81
-
82
-
83
-
84
 |
 |

ENTERGY CORPORATION AND SUBSIDIARIES 2002 51
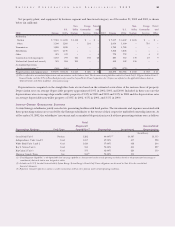
JOINTLY-OWNED GENERATING STATIONS
Certain Entergy subsidiaries jointly own electric generating facilities with third parties. The investments and expenses associated with
these generating stations are recorded by the Entergy subsidiaries to the extent of their respective undivided ownership interests. As
of December 31, 2002, the subsidiaries’ investment and accumulated depreciation in each of these generating stations were as follows:
Total
Megawatt Accumulated
Generating Stations Fuel-Type Capability(1) Ownership Investment Depreciation
(In millions)
Grand Gulf Unit 1 Nuclear 1,282 90.00%(2) $3,587 $1,515
Independence Units 1 and 2 Coal 1,657 47.90% 457 228
White Bluff Units 1 and 2 Coal 1,620 57.00% 418 244
Roy S. Nelson Unit 6 Coal 550 70.00% 404 227
Big Cajun 2 Unit 3 Coal 575 42.00% 229 119
Harrison County, Texas Gas 550(3) 70.00% 191 –
(1) “Total Megawatt Capability” is the dependable load carrying capability as demonstrated under actual operating conditions based on the primary fuel (assuming no
curtailments) that each station was designed to utilize.
(2) Includes an 11.5% leasehold interest held by System Energy. System Energy’s Grand Gulf 1 lease obligations are discussed in Note 10 to the consolidated
financial statements.
(3) Represents estimated capacity as station is under construction and has yet to perform under actual operating conditions.
Non- Energy Parent Non- Energy Parent
U.S. Utility Commodity and U.S. Utility Commodity and
2002 Entergy Utility Nuclear Services Other 2001 Entergy Utility Nuclear Services Other
Production
Nuclear $ 7,581 $ 6,423 $ 1,158 $ – $ – $ 7,657 $ 6,642 $ 1,015 $ – $ –
Other 1,500 1,266 – 234 – 2,016 1,300 – 716 –
Transmission 1,828 1,828 – – – 1,788 1,788 – – –
Distribution 4,175 4,175 – – – 3,848 3,848 – – –
Other 921 917 – – 4 778 772 – 4 2
Construction work in progress 1,233 797 216 192 28 883 712 139 23 9
Nuclear fuel (leased and owned) 523 284 239 – – 498 302 196 – –
Accumulated provision
for decommissioning(1) (566) (566) – – – (578) (578) – – –
Property, plant, and equipment-net $17,195 $15,124 $ 1,613 $ 426 $ 32 $16,890 $14,786 $ 1,350 $ 743 $ 11
(1) This is reflected in accumulated depreciation and amortization on the balance sheet. The decommissioning liabilities related to Grand Gulf 1, Pilgrim, Indian Point 2,
Vermont Yankee, and the 30% of River Bend previously owned by Cajun Electric Power Cooperative, Inc. (Cajun) are reflected in the applicable balance sheets in
“Deferred Credits and Other Liabilities – Decommissioning.”
Net property, plant, and equipment by business segment and functional category, as of December 31, 2002 and 2001, is shown
below (in millions):
Depreciation is computed on the straight-line basis at rates based on the estimated service lives of the various classes of property.
Depreciation rates on average depreciable property approximated 2.9% in 2002, 2001, and 2000. Included in these rates are the
depreciation rates on average depreciable utility property of 2.8% in 2002 and 2001 and 2.9% in 2000 and the depreciation rates
on average depreciable non-utility property of 3.8% in 2002, 4.5% in 2001, and 3.5% in 2000.