Chevron 2015 Annual Report Download - page 81
Download and view the complete annual report
Please find page 81 of the 2015 Chevron annual report below. You can navigate through the pages in the report by either clicking on the pages listed below, or by using the keyword search tool below to find specific information within the annual report.-
 1
1 -
2
-
3
-
4
-
5
-
6
-
7
-
8
-
9
-
10
-
11
-
12
-
13
-
14
-
15
-
16
-
17
-
18
-
19
-
20
-
21
-
22
-
23
-
24
-
25
-
26
-
27
-
28
-
29
-
30
-
31
-
32
-
33
-
34
-
35
-
36
-
37
-
38
-
39
-
40
-
41
-
42
-
43
-
44
-
45
-
46
-
47
-
48
-
49
-
50
-
51
-
52
-
53
-
54
-
55
-
56
-
57
-
58
-
59
-
60
-
61
-
62
-
63
-
64
-
65
-
66
-
67
-
68
-
69
-
70
-
 71
71 -
 72
72 -
 73
73 -
 74
74 -
 75
75 -
 76
76 -
 77
77 -
 78
78 -
 79
79 -
 80
80 -
 81
81 -
 82
82 -
 83
83 -
 84
84 -
 85
85 -
 86
86 -
 87
87 -
 88
88
 |
 |

Supplemental information on Oil and Gas Producing Activities - Unaudited
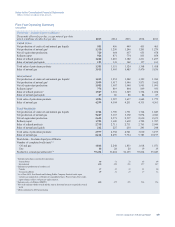
Table VI - Standardized Measure of Discounted Future Net Cash Flows Related to Proved Oil and Gas Reserves
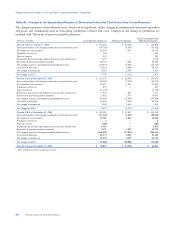
The standardized measure of discounted future net cash flows is calculated in accordance with SEC and FASB requirements.
This includes using the average of first-day-of-the-month oil and gas prices for the 12-month period prior to the end of the
reporting period, estimated future development and production costs assuming the continuation of existing economic
conditions, estimated costs for asset retirement obligations (includes costs to retire existing wells and facilities in addition to
those future wells and facilities necessary to produce proved undeveloped reserves), and estimated future income taxes based
on appropriate statutory tax rates. Discounted future net cash flows are calculated using 10 percent mid-period discount
factors. Estimates of proved-reserve quantities are imprecise and change over time as new information becomes available.
Probable and possible reserves, which may become proved in the future, are excluded from the calculations. The valuation
requires assumptions as to the timing and amount of future development and production costs. The calculations are made as
of December 31 each year and do not represent management’s estimate of the company’s future cash flows or value of its oil
and gas reserves. In the following table, the caption “Standardized Measure Net Cash Flows” refers to the standardized
measure of discounted future net cash flows.
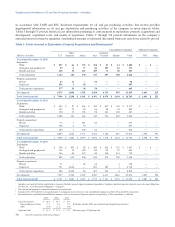
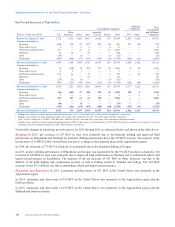
Consolidated Companies
Affiliated
Companies Total
Consolidated
and Affiliated
CompaniesMillions of dollars U.S.
Other
Americas Africa Asia
Australia/
Oceania Europe Total TCO Other
At December 31, 2015
Future cash inflows from production $ 67,536 $ 39,363 $ 52,128 $ 58,645 $ 93,550 $ 8,561 $ 319,783 $ 75,378 $ 17,519 $ 412,680
Future production costs (33,895) (26,477) (22,963) (27,499) (10,814) (6,994) (128,642) (17,959) (6,546) (153,147)
Future development costs (12,625) (5,485) (6,562) (8,924) (11,612) (1,751) (46,959) (17,232) (3,226) (67,417)
Future income taxes (4,161) (2,316) (14,681) (9,229) (21,337) 70 (51,654) (12,056) (3,460) (67,170)
Undiscounted future net cash flows 16,855 5,085 7,922 12,993 49,787 (114) 92,528 28,131 4,287 124,946
10 percent midyear annual discount
for timing of estimated cash flows (5,871) (2,830) (2,230) (3,673) (26,179) 292 (40,491) (15,249) (2,239) (57,979)
Standardized Measure
Net Cash Flows $ 10,984 $ 2,255 $ 5,692 $ 9,320 $ 23,608 $ 178 $ 52,037 $ 12,882 $ 2,048 $ 66,967
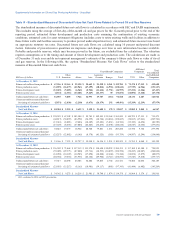
At December 31, 2014
Future cash inflows from production $ 138,385 $ 67,102 $ 103,304 $ 99,741 $ 142,541 $ 18,168 $ 569,241 $ 144,721 $ 37,511 $ 751,473
Future production costs (42,817) (30,899) (26,992) (34,359) (12,744) (10,814) (158,625) (30,015) (17,061) (205,701)
Future development costs (13,616) (8,283) (9,486) (12,629) (15,681) (3,031) (62,726) (19,349) (4,454) (86,529)
Future income taxes (27,129) (8,445) (47,884) (24,225) (34,235) (2,692) (144,610) (28,607) (6,634) (179,851)
Undiscounted future net cash flows 54,823 19,475 18,942 28,528 79,881 1,631 203,280 66,750 9,362 279,392
10 percent midyear annual discount
for timing of estimated cash flows (23,257) (12,082) (6,145) (8,570) (43,325) (380) (93,759) (34,987) (5,294) (134,040)
Standardized Measure
Net Cash Flows $ 31,566 $ 7,393 $ 12,797 $ 19,958 $ 36,556 $ 1,251 $ 109,521 $ 31,763 $ 4,068 $ 145,352
At December 31, 20131
Future cash inflows from production $ 136,942 $ 73,468 $ 117,119 $ 111,970 $ 130,620 $ 20,232 $ 590,351 $ 157,108 $ 43,380 $ 790,839
Future production costs (39,009) (29,373) (27,800) (35,716) (12,593) (10,099) (154,590) (32,245) (18,027) (204,862)
Future development costs (12,058) (10,149) (10,983) (17,290) (18,220) (2,644) (71,344) (12,852) (3,879) (88,075)
Future income taxes (28,458) (9,454) (53,953) (26,162) (29,942) (4,727) (152,696) (33,603) (9,418) (195,717)
Undiscounted future net cash flows 57,417 24,492 24,383 32,802 69,865 2,762 211,721 78,408 12,056 302,185
10 percent midyear annual discount
for timing of estimated cash flows (23,055) (15,217) (8,165) (10,901) (39,117) (888) (97,343) (41,444) (6,482) (145,269)
Standardized Measure
Net Cash Flows $ 34,362 $ 9,275 $ 16,218 $ 21,901 $ 30,748 $ 1,874 $ 114,378 $ 36,964 $ 5,574 $ 156,916
12013 conformed to 2014 and 2015 presentation.
Chevron Corporation 2015 Annual Report 79