Chevron 2015 Annual Report Download - page 74
Download and view the complete annual report
Please find page 74 of the 2015 Chevron annual report below. You can navigate through the pages in the report by either clicking on the pages listed below, or by using the keyword search tool below to find specific information within the annual report.-
 1
1 -
2
-
3
-
4
-
5
-
6
-
7
-
8
-
9
-
10
-
11
-
12
-
13
-
14
-
15
-
16
-
17
-
18
-
19
-
20
-
21
-
22
-
23
-
24
-
25
-
26
-
27
-
28
-
29
-
30
-
31
-
32
-
33
-
34
-
35
-
36
-
37
-
38
-
39
-
40
-
41
-
42
-
43
-
44
-
45
-
46
-
47
-
48
-
49
-
50
-
51
-
52
-
53
-
54
-
55
-
56
-
57
-
58
-
59
-
60
-
61
-
62
-
63
-
 64
64 -
 65
65 -
 66
66 -
 67
67 -
 68
68 -
 69
69 -
 70
70 -
 71
71 -
 72
72 -
 73
73 -
 74
74 -
 75
75 -
 76
76 -
 77
77 -
 78
78 -
 79
79 -
 80
80 -
 81
81 -
 82
82 -
 83
83 -
 84
84 -
85
-
86
-
87
-
88
 |
 |

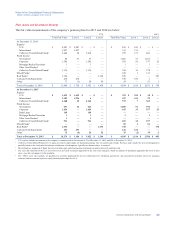
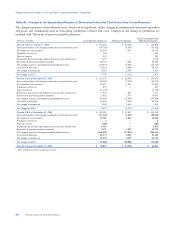
Supplemental Information on Oil and Gas Producing Activities - Unaudited
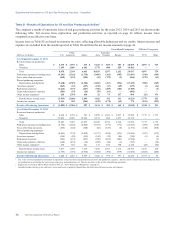
Table III - Results of Operations for Oil and Gas Producing Activities1
The company’s results of operations from oil and gas producing activities for the years 2015, 2014 and 2013 are shown in the
following table. Net income from exploration and production activities as reported on page 46 reflects income taxes
computed on an effective rate basis.
Income taxes in Table III are based on statutory tax rates, reflecting allowable deductions and tax credits. Interest income and
expense are excluded from the results reported in Table III and from the net income amounts on page 46.
Consolidated Companies Affiliated Companies
Millions of dollars U.S.
Other
Americas Africa Asia
Australia/
Oceania Europe Total TCO Other
Year Ended December 31, 2015
Revenues from net production
Sales $ 1,475 $ 1,155 $ 279 $ 6,254 $ 889 $ 403 $ 10,455 $ 4,097 $ 729
Transfers 7,195 1,089 6,182 3,779 408 829 19,482 — —
Total 8,670 2,244 6,461 10,033 1,297 1,232 29,937 4,097 729
Production expenses excluding taxes (4,293) (1,162) (1,758) (3,601) (162) (505) (11,481) (510) (365)
Taxes other than on income (430) (123) (124) (15) (172) (2) (866) (279) (31)
Proved producing properties:
Depreciation and depletion (7,640) (2,519) (2,506) (3,887) (217) (556) (17,325) (501) (169)
Accretion expense2(265) (23) (127) (158) (37) (69) (679) (3) (14)
Exploration expenses (1,614) (137) (667) (492) (289) (106) (3,305) — (1)
Unproved properties valuation (583) (55) (24) (79) (61) — (802) — —
Other income (expense)3220 (291) 638 21 73 237 898 (25) 373
Results before income taxes (5,935) (2,066) 1,893 1,822 432 231 (3,623) 2,779 522
Income tax expense 2,133 550 (986) (679) (178) (62) 778 (835) (291)
Results of Producing Operations $ (3,802) $ (1,516) $ 907 $ 1,143 $ 254 $ 169 $ (2,845) $ 1,944 $ 231
Year Ended December 31, 2014
Revenues from net production
Sales $ 2,660 $ 1,338 $ 707 $ 8,290 $ 1,466 $ 1,037 $ 15,498 $ 7,717 $ 1,733
Transfers 13,023 2,285 12,546 8,153 888 1,277 38,172 — —
Total 15,683 3,623 13,253 16,443 2,354 2,314 53,670 7,717 1,733
Production expenses excluding taxes (4,786) (1,328) (2,084) (4,527) (191) (773) (13,689) (493) (670)
Taxes other than on income (654) (122) (140) (82) (329) (4) (1,331) (344) (418)
Proved producing properties:
Depreciation and depletion (4,605) (793) (3,092) (3,977) (208) (351) (13,026) (567) (175)
Accretion expense2(334) (22) (130) (142) (32) (84) (744) (9) (4)
Exploration expenses (581) (119) (383) (309) (269) (281) (1,942) — (5)
Unproved properties valuation (140) (219) (12) (289) (40) (3) (703) — (38)
Other income (expense)3654 674 221 115 102 358 2,124 (28) (85)
Results before income taxes 5,237 1,694 7,633 7,232 1,387 1,176 24,359 6,276 338
Income tax expense (1,955) (471) (4,924) (3,604) (392) (579) (11,925) (1,883) (284)
Results of Producing Operations $ 3,282 $ 1,223 $ 2,709 $ 3,628 $ 995 $ 597 $ 12,434 $ 4,393 $ 54
1The value of owned production consumed in operations as fuel has been eliminated from revenues and production expenses, and the related volumes have been deducted from
net production in calculating the unit average sales price and production cost. This has no effect on the results of producing operations.
2Represents accretion of ARO liability. Refer to Note 25, “Asset Retirement Obligations,” on page 67.
3Includes foreign currency gains and losses, gains and losses on property dispositions and other miscellaneous income and expenses.
72 Chevron Corporation 2015 Annual Report