Chevron 2015 Annual Report Download - page 15
Download and view the complete annual report
Please find page 15 of the 2015 Chevron annual report below. You can navigate through the pages in the report by either clicking on the pages listed below, or by using the keyword search tool below to find specific information within the annual report.-
 1
1 -
2
-
3
-
4
-
 5
5 -
 6
6 -
 7
7 -
 8
8 -
 9
9 -
 10
10 -
 11
11 -
 12
12 -
 13
13 -
 14
14 -
 15
15 -
 16
16 -
 17
17 -
 18
18 -
 19
19 -
 20
20 -
 21
21 -
 22
22 -
 23
23 -
 24
24 -
 25
25 -
26
-
27
-
28
-
29
-
30
-
31
-
32
-
33
-
34
-
35
-
36
-
37
-
38
-
39
-
40
-
41
-
42
-
43
-
44
-
45
-
46
-
47
-
48
-
49
-
50
-
51
-
52
-
53
-
54
-
55
-
56
-
57
-
58
-
59
-
60
-
61
-
62
-
63
-
64
-
65
-
66
-
67
-
68
-
69
-
70
-
71
-
72
-
73
-
74
-
75
-
76
-
77
-
78
-
79
-
80
-
81
-
82
-
83
-
84
-
85
-
86
-
87
-
88
 |
 |
Management’s Discussion and Analysis of Financial Condition and Results of Operations
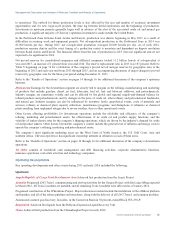
to operations. The outlook for future production levels is also affected by the size and number of economic investment
opportunities and, for new, large-scale projects, the time lag between initial exploration and the beginning of production.
Investments in upstream projects generally begin well in advance of the start of the associated crude oil and natural gas
production. A significant majority of Chevron’s upstream investment is made outside the United States.
In the Partitioned Zone between Saudi Arabia and Kuwait, production was shut-in beginning in May 2015 as a result of
difficulties in securing work and equipment permits. Net oil-equivalent production in the Partitioned Zone in 2014 was
81,000 barrels per day. During 2015, net oil-equivalent production averaged 28,000 barrels per day. As of early 2016,
production remains shut-in and the exact timing of a production restart is uncertain and dependent on dispute resolution
between Saudi Arabia and Kuwait. The financial effects from the loss of production in 2015 were not significant and are not
expected to be significant in 2016.
Net proved reserves for consolidated companies and affiliated companies totaled 11.2 billion barrels of oil-equivalent at
year-end 2015, an increase of 1 percent from year-end 2014. The reserve replacement ratio in 2015 was 107 percent. Refer to
Table V beginning on page 74 for a tabulation of the company’s proved net oil and gas reserves by geographic area, at the
beginning of 2013 and each year-end from 2013 through 2015, and an accompanying discussion of major changes to proved
reserves by geographic area for the three-year period ending December 31, 2015.
Refer to the “Results of Operations” section on pages 14 through 16 for additional discussion of the company’s upstream
business.
Downstream Earnings for the downstream segment are closely tied to margins on the refining, manufacturing and marketing
of products that include gasoline, diesel, jet fuel, lubricants, fuel oil, fuel and lubricant additives, and petrochemicals.
Industry margins are sometimes volatile and can be affected by the global and regional supply-and-demand balance for
refined products and petrochemicals, and by changes in the price of crude oil, other refinery and petrochemical feedstocks,
and natural gas. Industry margins can also be influenced by inventory levels, geopolitical events, costs of materials and
services, refinery or chemical plant capacity utilization, maintenance programs, and disruptions at refineries or chemical
plants resulting from unplanned outages due to severe weather, fires or other operational events.
Other factors affecting profitability for downstream operations include the reliability and efficiency of the company’s
refining, marketing and petrochemical assets, the effectiveness of its crude oil and product supply functions, and the
volatility of tanker-charter rates for the company’s shipping operations, which are driven by the industry’s demand for crude
oil and product tankers. Other factors beyond the company’s control include the general level of inflation and energy costs to
operate the company’s refining, marketing and petrochemical assets.
The company’s most significant marketing areas are the West Coast of North America, the U.S. Gulf Coast, Asia and
southern Africa. Chevron operates or has significant ownership interests in refineries in each of these areas.
Refer to the “Results of Operations” section on pages 14 through 16 for additional discussion of the company’s downstream
operations.
All Other consists of worldwide cash management and debt financing activities, corporate administrative functions,
insurance operations, real estate activities and technology companies.
Operating Developments
Key operating developments and other events during 2015 and early 2016 included the following:
Upstream
Angola-Republic of Congo Joint Development Area Achieved first production from the Lianzi Project.
Australia Progressed LNG Train 1 commissioning and start-up activities for the Gorgon Project, with first cargo lifting expected
in March 2016. All Train 2 modules are installed, and all remaining Train 3 modules were delivered as of January 2016.
Progressed construction of the Wheatstone Project. Major milestones reached include the installation of the offshore platform
and topsides, and all of the subsea pipelines and structures, along with the delivery of all LNG Train 1 and common modules.
Announced a natural gas discovery, Isosceles, in the Carnarvon Basin in 50 percent-owned Block WA-392-P.
Bangladesh Achieved first liquids from the Bibiyana Expansion Liquid Recovery Unit.
China Achieved first production from the Chuandongbei Project in early 2016.
Chevron Corporation 2015 Annual Report 13