Chevron 2015 Annual Report Download - page 48
Download and view the complete annual report
Please find page 48 of the 2015 Chevron annual report below. You can navigate through the pages in the report by either clicking on the pages listed below, or by using the keyword search tool below to find specific information within the annual report.-
 1
1 -
2
-
3
-
4
-
5
-
6
-
7
-
8
-
9
-
10
-
11
-
12
-
13
-
14
-
15
-
16
-
17
-
18
-
19
-
20
-
21
-
22
-
23
-
24
-
25
-
26
-
27
-
28
-
29
-
30
-
31
-
32
-
33
-
34
-
35
-
36
-
37
-
 38
38 -
 39
39 -
 40
40 -
 41
41 -
 42
42 -
 43
43 -
 44
44 -
 45
45 -
 46
46 -
 47
47 -
 48
48 -
 49
49 -
 50
50 -
 51
51 -
 52
52 -
 53
53 -
 54
54 -
 55
55 -
 56
56 -
 57
57 -
 58
58 -
59
-
60
-
61
-
62
-
63
-
64
-
65
-
66
-
67
-
68
-
69
-
70
-
71
-
72
-
73
-
74
-
75
-
76
-
77
-
78
-
79
-
80
-
81
-
82
-
83
-
84
-
85
-
86
-
87
-
88
 |
 |

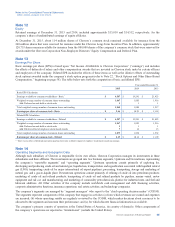
Notes to the Consolidated Financial Statements
Millions of dollars, except per-share amounts
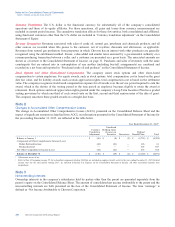
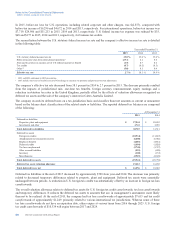
Segment Earnings The company evaluates the performance of its operating segments on an after-tax basis, without
considering the effects of debt financing interest expense or investment interest income, both of which are managed by the
company on a worldwide basis. Corporate administrative costs and assets are not allocated to the operating segments.
However, operating segments are billed for the direct use of corporate services. Nonbillable costs remain at the corporate
level in “All Other.” Earnings by major operating area are presented in the following table:
Year ended December 31
2015 2014 2013
Upstream
United States $ (4,055) $ 3,327 $ 4,044
International 2,094 13,566 16,765
Total Upstream (1,961) 16,893 20,809
Downstream
United States 3,182 2,637 787
International 4,419 1,699 1,450
Total Downstream 7,601 4,336 2,237
Total Segment Earnings 5,640 21,229 23,046
All Other
Interest income 65 77 80
Other (1,118) (2,065) (1,703)
Net Income Attributable to Chevron Corporation $ 4,587 $ 19,241 $ 21,423
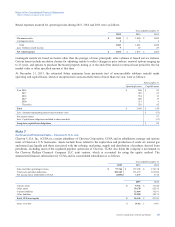
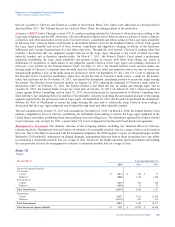
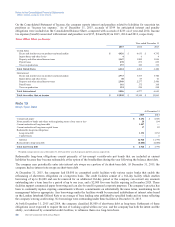
Segment Assets Segment assets do not include intercompany investments or receivables. Assets at year-end 2015 and 2014
are as follows:
At December 31
2015 20141
Upstream
United States $ 46,407 $ 49,343
International 163,217 152,736
Goodwill 4,588 4,593
Total Upstream 214,212 206,672
Downstream
United States 21,408 23,068
International 14,982 17,723
Total Downstream 36,390 40,791
Total Segment Assets 250,602 247,463
All Other
United States 5,076 6,603
International 10,425 11,960
Total All Other 15,501 18,563
Total Assets – United States 72,891 79,014
Total Assets – International 188,624 182,419
Goodwill 4,588 4,593
Total Assets $ 266,103 $ 266,026
12014 conformed to 2015 presentation.
Segment Sales and Other Operating Revenues Operating segment sales and other operating revenues, including internal
transfers, for the years 2015, 2014 and 2013, are presented in the table on the next page. Products are transferred between
operating segments at internal product values that approximate market prices.
Revenues for the upstream segment are derived primarily from the production and sale of crude oil and natural gas, as well as
the sale of third-party production of natural gas. Revenues for the downstream segment are derived from the refining and
marketing of petroleum products such as gasoline, jet fuel, gas oils, lubricants, residual fuel oils and other products derived
from crude oil. This segment also generates revenues from the manufacture and sale of fuel and lubricant additives and the
transportation and trading of refined products and crude oil. “All Other” activities include revenues from insurance
operations, real estate activities and technology companies.
46 Chevron Corporation 2015 Annual Report