Chevron 2015 Annual Report Download - page 76
Download and view the complete annual report
Please find page 76 of the 2015 Chevron annual report below. You can navigate through the pages in the report by either clicking on the pages listed below, or by using the keyword search tool below to find specific information within the annual report.-
 1
1 -
2
-
3
-
4
-
5
-
6
-
7
-
8
-
9
-
10
-
11
-
12
-
13
-
14
-
15
-
16
-
17
-
18
-
19
-
20
-
21
-
22
-
23
-
24
-
25
-
26
-
27
-
28
-
29
-
30
-
31
-
32
-
33
-
34
-
35
-
36
-
37
-
38
-
39
-
40
-
41
-
42
-
43
-
44
-
45
-
46
-
47
-
48
-
49
-
50
-
51
-
52
-
53
-
54
-
55
-
56
-
57
-
58
-
59
-
60
-
61
-
62
-
63
-
64
-
65
-
 66
66 -
 67
67 -
 68
68 -
 69
69 -
 70
70 -
 71
71 -
 72
72 -
 73
73 -
 74
74 -
 75
75 -
 76
76 -
 77
77 -
 78
78 -
 79
79 -
 80
80 -
 81
81 -
 82
82 -
 83
83 -
 84
84 -
 85
85 -
 86
86 -
87
-
88
 |
 |

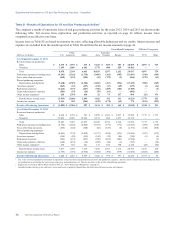
Supplemental Information on Oil and Gas Producing Activities - Unaudited
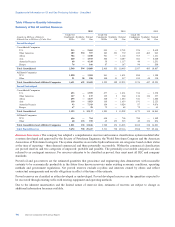
Table V Reserve Quantity Information
Summary of Net Oil and Gas Reserves
2015 2014 2013
Liquids in Millions of Barrels
Natural Gas in Billions of Cubic Feet
Crude Oil
Condensate
NGLs
Synthetic
Oil
Natural
Gas
Crude Oil
Condensate
NGLs
Synthetic
Oil
Natural
Gas
Crude Oil
Condensate
NGLs
Synthetic
Oil
Natural
Gas
Proved Developed
Consolidated Companies
U.S. 933 — 2,683 955 — 2,743 976 — 2,632
Other Americas 109 594 597 103 531 739 109 403 943
Africa 702 — 1,100 701 — 1,112 763 — 1,161
Asia 660 — 4,933 584 — 4,607 601 — 4,620
Australia/Oceania 60 — 4,330 38 — 1,117 44 — 1,251
Europe 76 — 166 87 — 167 94 — 200
Total Consolidated 2,540 594 13,809 2,468 531 10,485 2,587 403 10,807
Affiliated Companies
TCO 1,020 — 1,504 961 — 1,431 884 — 1,188
Other 91 58 288 100 51 317 105 44 330
Total Consolidated and Affiliated Companies 3,651 652 15,601 3,529 582 12,233 3,576 447 12,325
Proved Undeveloped
Consolidated Companies
U.S. 453 — 1,559 477 — 1,431 354 — 1,358
Other Americas 127 3 117 135 3 384 134 134 357
Africa 255 — 1,837 320 — 1,856 341 — 1,884
Asia 130 — 1,023 168 — 1,659 191 — 2,125
Australia/Oceania 93 — 7,543 104 — 9,824 87 — 9,076
Europe 67 —58 79 —68 72 —63
Total Consolidated 1,125 3 12,137 1,283 3 15,222 1,179 134 14,863
Affiliated Companies
TCO 656 — 764 654 — 746 784 — 1,102
Other 40 135 935 45 153 915 49 176 856
Total Consolidated and Affiliated Companies 1,821 138 13,836 1,982 156 16,883 2,012 310 16,821
Total Proved Reserves 5,472 790 29,437 5,511 738 29,116 5,588 757 29,146
Reserves Governance The company has adopted a comprehensive reserves and resource classification system modeled after
a system developed and approved by the Society of Petroleum Engineers, the World Petroleum Congress and the American
Association of Petroleum Geologists. The system classifies recoverable hydrocarbons into six categories based on their status
at the time of reporting – three deemed commercial and three potentially recoverable. Within the commercial classification
are proved reserves and two categories of unproved: probable and possible. The potentially recoverable categories are also
referred to as contingent resources. For reserves estimates to be classified as proved, they must meet all SEC and company
standards.
Proved oil and gas reserves are the estimated quantities that geoscience and engineering data demonstrate with reasonable
certainty to be economically producible in the future from known reservoirs under existing economic conditions, operating
methods and government regulations. Net proved reserves exclude royalties and interests owned by others and reflect
contractual arrangements and royalty obligations in effect at the time of the estimate.
Proved reserves are classified as either developed or undeveloped. Proved developed reserves are the quantities expected to
be recovered through existing wells with existing equipment and operating methods.
Due to the inherent uncertainties and the limited nature of reservoir data, estimates of reserves are subject to change as
additional information becomes available.
74 Chevron Corporation 2015 Annual Report