Chevron 2015 Annual Report Download - page 18
Download and view the complete annual report
Please find page 18 of the 2015 Chevron annual report below. You can navigate through the pages in the report by either clicking on the pages listed below, or by using the keyword search tool below to find specific information within the annual report.-
 1
1 -
2
-
3
-
4
-
5
-
6
-
7
-
 8
8 -
 9
9 -
 10
10 -
 11
11 -
 12
12 -
 13
13 -
 14
14 -
 15
15 -
 16
16 -
 17
17 -
 18
18 -
 19
19 -
 20
20 -
 21
21 -
 22
22 -
 23
23 -
 24
24 -
 25
25 -
 26
26 -
 27
27 -
 28
28 -
29
-
30
-
31
-
32
-
33
-
34
-
35
-
36
-
37
-
38
-
39
-
40
-
41
-
42
-
43
-
44
-
45
-
46
-
47
-
48
-
49
-
50
-
51
-
52
-
53
-
54
-
55
-
56
-
57
-
58
-
59
-
60
-
61
-
62
-
63
-
64
-
65
-
66
-
67
-
68
-
69
-
70
-
71
-
72
-
73
-
74
-
75
-
76
-
77
-
78
-
79
-
80
-
81
-
82
-
83
-
84
-
85
-
86
-
87
-
88
 |
 |

Management’s Discussion and Analysis of Financial Condition and Results of Operations
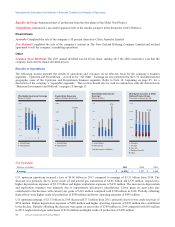
U.S. Downstream
Millions of dollars 2015 2014 2013
Earnings $ 3,182 $ 2,637 $ 787
U.S. downstream operations earned $3.18 billion in 2015, compared with $2.64 billion in 2014. The increase was due to
higher margins on refined product sales of $1.51 billion, partially offset by the absence of 2014 asset sale gains of
$960 million.
U.S. downstream operations earned $2.64 billion in 2014, compared with $787 million in 2013. The increase in earnings was
mainly due to higher margins on refined product sales of $830 million. Gains from asset sales were $960 million in 2014,
compared with $250 million in 2013. Higher earnings from 50 percent-owned Chevron Phillips Chemical Company, LLC
(CPChem) of $160 million and lower operating expenses of $80 million also contributed to the earnings increase.
Refined product sales of 1.23 million barrels per day in 2015 increased 1 percent, mainly reflecting higher sales of jet fuel.
Sales volumes of refined products were 1.21 million barrels per day in 2014, an increase of 2 percent from 2013, mainly
reflecting higher gas oil sales. U.S. branded gasoline sales of 522,000 barrels per day in 2015 increased 1 percent from 2014
and 2013.
Refer to the “Selected Operating Data” table on page 19 for a three-year comparison of sales volumes of gasoline and other
refined products and refinery input volumes.
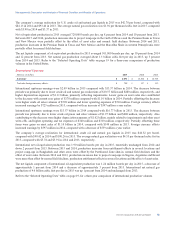
International Downstream
Millions of dollars 2015 2014 2013
Earnings*$ 4,419 $ 1,699 $ 1,450
*Includes foreign currency effects: $47$ (112) $ (76)
International downstream earned $4.42 billion in 2015, compared with $1.70 billion in 2014. The increase was primarily due
to a $1.6 billion gain from the sale of the company’s interest in Caltex Australia Limited in second quarter 2015 and higher
margins on refined product sales of $690 million. Foreign currency effects increased earnings by $47 million in 2015,
compared to a decrease of $112 million a year earlier.
International downstream earned $1.70 billion in 2014, compared with $1.45 billion in 2013. The increase was mainly due to
a favorable change in the effects on derivative instruments of $640 million. The increase was partially offset by the economic
buyout of a legacy pension obligation of $160 million in the 2014 period, lower margins on refined product sales of $130
million and higher tax expenses of $110 million. Foreign currency effects decreased earnings by $112 million in 2014,
compared with a decrease of $76 million a year earlier.
Total refined product sales of 1.51 million barrels per day in 2015 were essentially unchanged from 2014. Excluding the
effects of the Caltex Australia Limited divestment, refined product sales were up 107,000 barrels per day, primarily
reflecting higher sales of jet fuel, gasoline and gas oil. Sales of 1.50 million barrels per day in 2014 declined 2 percent from
2013, mainly reflecting lower gas oil sales.
Refer to the “Selected Operating Data” table, on page 19, for a three-year comparison of sales volumes of gasoline and other
refined products and refinery input volumes.
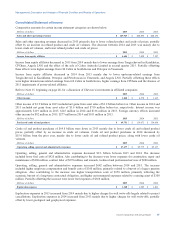
All Other
Millions of dollars 2015 2014 2013
Net charges*$ (1,053) $ (1,988) $ (1,623)
*Includes foreign currency effects: $ (3) $ 2$ (9)
All Other consists of worldwide cash management and debt financing activities, corporate administrative functions,
insurance operations, real estate activities, and technology companies.
Net charges in 2015 decreased $935 million from 2014, mainly due to lower corporate tax items and the absence of 2014
charges related to mining assets, partially offset by higher charges related to reductions in corporate staffs. Net charges in
2014 increased $365 million from 2013, mainly due to higher environmental reserve additions, asset impairments and
additional asset retirement obligations for mining assets, as well as higher corporate tax items. These increases were partially
offset by the absence of 2013 impairments of power-related affiliates and lower other corporate charges.
16 Chevron Corporation 2015 Annual Report