Chevron 2015 Annual Report Download - page 16
Download and view the complete annual report
Please find page 16 of the 2015 Chevron annual report below. You can navigate through the pages in the report by either clicking on the pages listed below, or by using the keyword search tool below to find specific information within the annual report.-
 1
1 -
2
-
3
-
4
-
5
-
 6
6 -
 7
7 -
 8
8 -
 9
9 -
 10
10 -
 11
11 -
 12
12 -
 13
13 -
 14
14 -
 15
15 -
 16
16 -
 17
17 -
 18
18 -
 19
19 -
 20
20 -
 21
21 -
 22
22 -
 23
23 -
 24
24 -
 25
25 -
 26
26 -
27
-
28
-
29
-
30
-
31
-
32
-
33
-
34
-
35
-
36
-
37
-
38
-
39
-
40
-
41
-
42
-
43
-
44
-
45
-
46
-
47
-
48
-
49
-
50
-
51
-
52
-
53
-
54
-
55
-
56
-
57
-
58
-
59
-
60
-
61
-
62
-
63
-
64
-
65
-
66
-
67
-
68
-
69
-
70
-
71
-
72
-
73
-
74
-
75
-
76
-
77
-
78
-
79
-
80
-
81
-
82
-
83
-
84
-
85
-
86
-
87
-
88
 |
 |

Management’s Discussion and Analysis of Financial Condition and Results of Operations
Republic of Congo Announced start of production from the first phase of the Moho Nord Project.
United States Announced a successful appraisal well at the Anchor prospect in the deepwater Gulf of Mexico.
Downstream
Australia Completed the sale of the company’s 50 percent interest in Caltex Australia Limited.
New Zealand Completed the sale of the company’s interest in The New Zealand Refining Company Limited and reached
agreement to sell the company’s marketing operations.
Other
Common Stock Dividends The 2015 annual dividend was $4.28 per share, making 2015 the 28th consecutive year that the
company increased its annual dividend payout.
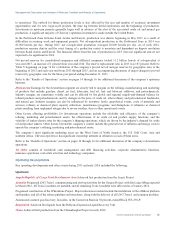
Results of Operations
The following section presents the results of operations and variances on an after-tax basis for the company’s business
segments – Upstream and Downstream – as well as for “All Other.” Earnings are also presented for the U.S. and international
geographic areas of the Upstream and Downstream business segments. Refer to Note 14, beginning on page 45, for a
discussion of the company’s “reportable segments.” This section should also be read in conjunction with the discussion in
“Business Environment and Outlook” on pages 10 through 13.
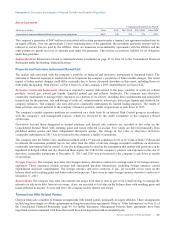
0
4000
3000
2000
1000
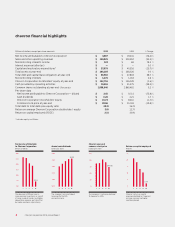
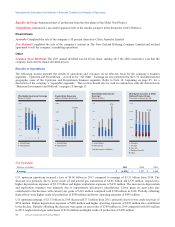
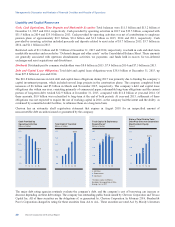
Exploration Expenses
Millions of dollars (before-tax)
United States
International
1211 13 14 15
$3,340
-7.0
28.0
14.0
21.0
0.0
7.0
Worldwide Upstream Earnings
Billions of dollars
United States
International
1211 13 14 15
$(2.0)
United States
International
*Includes equity in affiliates.
0.0
8.0
6.0
2.0
4.0
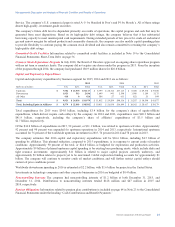
Worldwide Downstream
Earnings*
Billions of dollars
$7.6
1211 13 14 15
0
3600
2700
1800
900
Worldwide Gasoline & Other
Refined Product Sales
Thousands of barrels per day
Gasoline
Jet Fuel
Gas Oils
Residual Fuel Oil
Other
2,735
1211 13 14 15
U.S. Upstream
Millions of dollars 2015 2014 2013
Earnings $ (4,055) $ 3,327 $ 4,044
U.S. upstream operations incurred a loss of $4.06 billion in 2015 compared to earnings of $3.33 billion from 2014. The
decrease was primarily due to lower crude oil and natural gas realizations of $4.86 billion and $570 million, respectively,
higher depreciation expenses of $2.19 billion and higher exploration expenses of $650 million. The increase in depreciation
and exploration expenses was primarily due to impairments and project cancellations. Lower gains on asset sales also
contributed to the decrease with current year gains of $110 million compared with $700 million in 2014. Partially offsetting
these effects were higher crude oil production of $900 million and lower operating expenses of $450 million.
U.S. upstream earnings of $3.33 billion in 2014 decreased $717 million from 2013, primarily due to lower crude oil prices of
$950 million. Higher depreciation expenses of $440 million and higher operating expenses of $210 million also contributed
to the decline. Partially offsetting the decrease were gains on asset sales of $700 million in 2014 compared with $60 million
in 2013, higher natural gas realizations of $150 million and higher crude oil production of $100 million.
14 Chevron Corporation 2015 Annual Report