Chevron 2015 Annual Report Download - page 51
Download and view the complete annual report
Please find page 51 of the 2015 Chevron annual report below. You can navigate through the pages in the report by either clicking on the pages listed below, or by using the keyword search tool below to find specific information within the annual report.-
 1
1 -
2
-
3
-
4
-
5
-
6
-
7
-
8
-
9
-
10
-
11
-
12
-
13
-
14
-
15
-
16
-
17
-
18
-
19
-
20
-
21
-
22
-
23
-
24
-
25
-
26
-
27
-
28
-
29
-
30
-
31
-
32
-
33
-
34
-
35
-
36
-
37
-
38
-
39
-
40
-
 41
41 -
 42
42 -
 43
43 -
 44
44 -
 45
45 -
 46
46 -
 47
47 -
 48
48 -
 49
49 -
 50
50 -
 51
51 -
 52
52 -
 53
53 -
 54
54 -
 55
55 -
 56
56 -
 57
57 -
 58
58 -
 59
59 -
 60
60 -
 61
61 -
62
-
63
-
64
-
65
-
66
-
67
-
68
-
69
-
70
-
71
-
72
-
73
-
74
-
75
-
76
-
77
-
78
-
79
-
80
-
81
-
82
-
83
-
84
-
85
-
86
-
87
-
88
 |
 |

Notes to the Consolidated Financial Statements
Millions of dollars, except per-share amounts
GS Caltex Corporation Chevron owns 50 percent of GS Caltex Corporation, a joint venture with GS Energy. The joint
venture imports, refines and markets petroleum products, petrochemicals and lubricants, predominantly in South Korea.
Chevron Phillips Chemical Company LLC Chevron owns 50 percent of Chevron Phillips Chemical Company LLC. The
other half is owned by Phillips 66.
Caltex Australia Ltd. Chevron sold its 50 percent equity ownership interest in Caltex Australia Ltd. (CAL) in second quarter
2015.
Other Information “Sales and other operating revenues” on the Consolidated Statement of Income includes $4,850, $10,404
and $14,635 with affiliated companies for 2015, 2014 and 2013, respectively. “Purchased crude oil and products” includes
$4,240, $6,735 and $7,063 with affiliated companies for 2015, 2014 and 2013, respectively.
“Accounts and notes receivable” on the Consolidated Balance Sheet includes $399 and $924 due from affiliated companies at
December 31, 2015 and 2014, respectively. “Accounts payable” includes $286 and $345 due to affiliated companies at
December 31, 2015 and 2014, respectively.
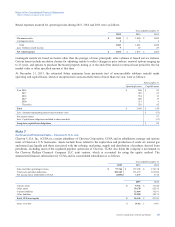
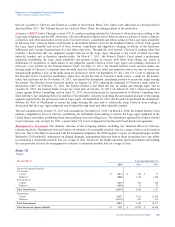
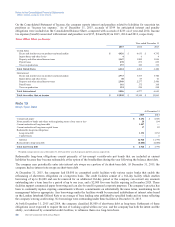
The following table provides summarized financial information on a 100 percent basis for all equity affiliates as well as
Chevron’s total share, which includes Chevron’s net loans to affiliates of $410, $874 and $1,129 at December 31, 2015, 2014
and 2013, respectively.
Affiliates Chevron Share
Year ended December 31 2015 2014 2013 2015 2014 2013
Total revenues $ 71,389 $ 123,003 $ 131,875 $ 33,492 $ 58,937 $ 63,101
Income before income tax expense 13,129 20,609 24,075 6,279 9,968 11,108
Net income attributable to affiliates 10,649 14,758 15,594 4,691 7,237 7,845
At December 31
Current assets $ 27,162 $ 35,662 $ 39,713 $ 10,657 $ 13,465 $ 15,156
Noncurrent assets 71,650 70,817 68,593 26,607 26,053 25,059
Current liabilities 20,559 25,308 29,642 7,351 9,588 11,587
Noncurrent liabilities 18,560 17,983 19,442 3,909 4,211 4,559
Total affiliates’ net equity $ 59,693 $ 63,188 $ 59,222 $ 26,004 $ 25,719 $ 24,069
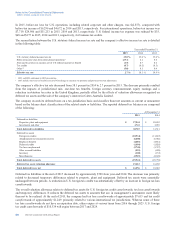
Note 16
Properties, Plant and Equipment1
At December 31 Year ended December 31
Gross Investment at Cost Net Investment Additions at Cost2Depreciation Expense3
2015 2014 2013 2015 2014 2013 2015 2014 2013 2015 2014 2013
Upstream
United States $ 93,848 $ 96,850 $ 89,555 $ 43,125 $ 45,864 $ 41,831 $ 6,586 $ 9,688 $ 8,188 $ 8,545 $ 5,127 $ 4,412
International 208,395 192,637 169,623 127,459 118,926 104,100 19,993 24,920 27,383 10,803 9,688 8,336
Total Upstream 302,243 289,487 259,178 170,584 164,790 145,931 26,579 34,608 35,571 19,348 14,815 12,748
Downstream
United States 23,202 22,640 22,407 10,807 11,019 11,481 696 588 1,154 878 886 780
International 9,177 9,334 9,303 4,090 4,219 4,139 365 530 653 355 396 360
Total Downstream 32,379 31,974 31,710 14,897 15,238 15,620 1,061 1,118 1,807 1,233 1,282 1,140
All Other
United States 5,500 5,673 5,402 2,859 3,077 3,194 357 581 721 439 680 286
International 155 155 143 56 68 84 525 23 17 16 12
Total All Other 5,655 5,828 5,545 2,915 3,145 3,278 362 606 744 456 696 298
Total United States 122,550 125,163 117,364 56,791 59,960 56,506 7,639 10,857 10,063 9,862 6,693 5,478
Total International 217,727 202,126 179,069 131,605 123,213 108,323 20,363 25,475 28,059 11,175 10,100 8,708
Total $ 340,277 $ 327,289 $ 296,433 $ 188,396 $ 183,173 $ 164,829 $ 28,002 $ 36,332 $ 38,122 $ 21,037 $ 16,793 $ 14,186
1Other than the United States, Australia and Nigeria, no other country accounted for 10 percent or more of the company’s net properties, plant and equipment (PP&E) in 2015.
Australia had $49,205, $41,012 and $31,464 in 2015, 2014, and 2013, respectively. Nigeria had PP&E of $18,773, $19,214 and $18,429 for 2015, 2014 and 2013, respectively.
2Net of dry hole expense related to prior years’ expenditures of $1,573, $371 and $89 in 2015, 2014 and 2013, respectively.
3Depreciation expense includes accretion expense of $715, $882 and $627 in 2015, 2014 and 2013, respectively, and impairments of $4,066, $1,274 and $382 in 2015, 2014 and
2013, respectively.
Chevron Corporation 2015 Annual Report 49