Chevron 2015 Annual Report Download - page 71
Download and view the complete annual report
Please find page 71 of the 2015 Chevron annual report below. You can navigate through the pages in the report by either clicking on the pages listed below, or by using the keyword search tool below to find specific information within the annual report.
Notes to the Consolidated Financial Statements
Millions of dollars, except per-share amounts
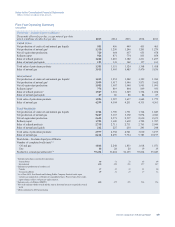
Five-Year Operating Summary
Unaudited
Worldwide – Includes Equity in Affiliates
Thousands of barrels per day, except natural gas data,
which is millions of cubic feet per day 2015 2014 2013 2012 2011
United States
Net production of crude oil and natural gas liquids 501 456 449 455 465
Net production of natural gas11,310 1,250 1,246 1,203 1,279
Net oil-equivalent production 720 664 657 655 678
Refinery input 924 871 774 833 854
Sales of refined products 1,228 1,210 1,182 1,211 1,257
Sales of natural gas liquids 153 141 142 157 161
Total sales of petroleum products 1,381 1,351 1,324 1,368 1,418
Sales of natural gas 3,913 3,995 5,483 5,470 5,836
International
Net production of crude oil and natural gas liquids21,243 1,253 1,282 1,309 1,384
Net production of natural gas13,959 3,917 3,946 3,871 3,662
Net oil-equivalent production 1,902 1,907 1,940 1,955 1,995
Refinery input3778 819 864 869 933
Sales of refined products41,507 1,501 1,529 1,554 1,692
Sales of natural gas liquids 89 86 88 88 87
Total sales of petroleum products 1,596 1,587 1,617 1,642 1,779
Sales of natural gas 4,299 4,304 4,251 4,315 4,361
Total Worldwide
Net production of crude oil and natural gas liquids 1,744 1,709 1,731 1,764 1,849
Net production of natural gas 5,269 5,167 5,192 5,074 4,941
Net oil-equivalent production 2,622 2,571 2,597 2,610 2,673
Refinery input 1,702 1,690 1,638 1,702 1,787
Sales of refined products 2,735 2,711 2,711 2,765 2,949
Sales of natural gas liquids 242 227 230 245 248
Total sales of petroleum products 2,977 2,938 2,941 3,010 3,197
Sales of natural gas 8,212 8,299 9,734 9,785 10,197
Worldwide – Excludes Equity in Affiliates
Number of completed wells (net)5, 6
Oil and gas 1,848 2,248 1,833 1,618 1,551
Dry 18 28 20 19 19
Productive oil and gas wells (net)5, 6 57,454 56,204 56,635 55,812 55,049
1Includes natural gas consumed in operations:
United States 66 71 72 65 69
International 430 452 458 457 447
2Includes net production of synthetic oil:
Canada 47 43 43 43 40
Venezuela affiliate 29 31 25 17 32
3As of June 2012, Star Petroleum Refining Public Company Limited crude-input
volumes are reported on a 100 percent consolidated basis. Prior to June 2012, crude-
input volumes reflect a 64 percent equity interest.
4Includes sales of affiliates (MBPD): 420 475 471 522 556
5Net wells include wholly owned and the sum of fractional interests in partially owned
wells
62014 conformed to 2015 presentation
Chevron Corporation 2015 Annual Report 69


