Chevron 2015 Annual Report Download - page 23
Download and view the complete annual report
Please find page 23 of the 2015 Chevron annual report below. You can navigate through the pages in the report by either clicking on the pages listed below, or by using the keyword search tool below to find specific information within the annual report.-
 1
1 -
2
-
3
-
4
-
5
-
6
-
7
-
8
-
9
-
10
-
11
-
12
-
 13
13 -
 14
14 -
 15
15 -
 16
16 -
 17
17 -
 18
18 -
 19
19 -
 20
20 -
 21
21 -
 22
22 -
 23
23 -
 24
24 -
 25
25 -
 26
26 -
 27
27 -
 28
28 -
 29
29 -
 30
30 -
 31
31 -
 32
32 -
 33
33 -
34
-
35
-
36
-
37
-
38
-
39
-
40
-
41
-
42
-
43
-
44
-
45
-
46
-
47
-
48
-
49
-
50
-
51
-
52
-
53
-
54
-
55
-
56
-
57
-
58
-
59
-
60
-
61
-
62
-
63
-
64
-
65
-
66
-
67
-
68
-
69
-
70
-
71
-
72
-
73
-
74
-
75
-
76
-
77
-
78
-
79
-
80
-
81
-
82
-
83
-
84
-
85
-
86
-
87
-
88
 |
 |

Management’s Discussion and Analysis of Financial Condition and Results of Operations
Service. The company’s U.S. commercial paper is rated A-1+ by Standard & Poor’s and P-l by Moody’s. All of these ratings
denote high-quality, investment-grade securities.
The company’s future debt level is dependent primarily on results of operations, the capital program and cash that may be
generated from asset dispositions. Based on its high-quality debt ratings, the company believes that it has substantial
borrowing capacity to meet unanticipated cash requirements. During extended periods of low prices for crude oil and natural
gas and narrow margins for refined products and commodity chemicals, the company can also modify capital spending plans
to provide flexibility to continue paying the common stock dividend and also remain committed to retaining the company’s
high-quality debt ratings.
Committed Credit Facilities Information related to committed credit facilities is included in Note 19 to the Consolidated
Financial Statements, Short-Term Debt, on page 56.
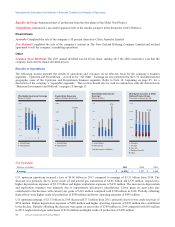
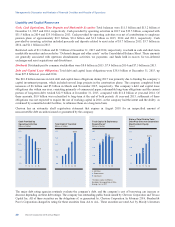
Common Stock Repurchase Program In July 2010, the Board of Directors approved an ongoing share repurchase program
with no set term or monetary limits. The company did not acquire any shares under the program in 2015. From the inception
of the program through 2014, the company had purchased 180.9 million shares for $20.0 billion.
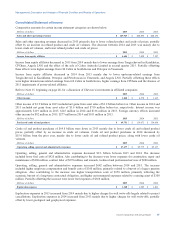
Capital and Exploratory Expenditures
Capital and exploratory expenditures by business segment for 2015, 2014 and 2013 are as follows:
2015 2014 2013
Millions of dollars U.S. Int’l. Total U.S. Int’l. Total U.S. Int’l. Total
Upstream $ 7,582 $ 23,535 $31,117 $ 8,799 $ 28,316 $37,115 $ 8,480 $ 29,378 $ 37,858
Downstream 1,923 513 2,436 1,649 941 2,590 1,986 1,189 3,175
All Other 418 8 426 584 27 611 821 23 844
Total $ 9,923 $ 24,056 $33,979 $ 11,032 $ 29,284 $40,316 $ 11,287 $ 30,590 $41,877
Total, Excluding Equity in Affiliates $ 8,579 $ 22,003 $30,582 $ 10,011 $ 26,838 $36,849 $ 10,562 $ 28,617 $ 39,179
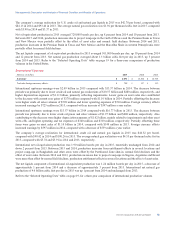
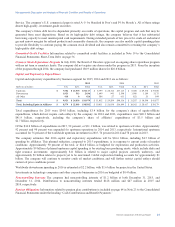
Total expenditures for 2015 were $34.0 billion, including $3.4 billion for the company’s share of equity-affiliate
expenditures, which did not require cash outlays by the company. In 2014 and 2013, expenditures were $40.3 billion and
$41.9 billion, respectively, including the company’s share of affiliates’ expenditures of $3.5 billion and
$2.7 billion, respectively.
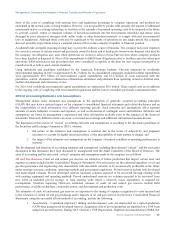
Of the $34.0 billion of expenditures in 2015, 92 percent, or $31.1 billion, was related to upstream activities. Approximately
92 percent and 90 percent was expended for upstream operations in 2014 and 2013, respectively. International upstream
accounted for 76 percent of the worldwide upstream investment in 2015, 76 percent in 2014 and 78 percent in 2013.
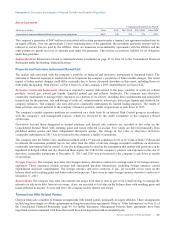
The company estimates that 2016 capital and exploratory expenditures will be $26.6 billion, including $4.5 billion of
spending by affiliates. This planned reduction, compared to 2015 expenditures, is in response to current crude oil market
conditions. Approximately 90 percent of the total, or $24.0 billion, is budgeted for exploration and production activities.
Approximately $9 billion of planned upstream capital spending is for existing base producing assets, which include shale and
tight resource investments. Approximately $11 billion is related to major capital projects currently underway, and
approximately $3 billion relates to projects yet to be sanctioned. Global exploration funding accounts for approximately $1
billion. The company will continue to monitor crude oil market conditions, and will further restrict capital outlays should
current oil price conditions persist.
Worldwide downstream spending in 2016 is estimated at $2.2 billion, with $1.6 billion for projects in the United States.
Investments in technology companies and other corporate businesses in 2016 are budgeted at $0.4 billion.
Noncontrolling Interests The company had noncontrolling interests of $1.2 billion at both December 31, 2015, and
December 31, 2014. Distributions to noncontrolling interests totaled $128 million and $47 million in 2015 and
2014, respectively.
Pension Obligations Information related to pension plan contributions is included on page 64 in Note 23 to the Consolidated
Financial Statements under the heading “Cash Contributions and Benefit Payments.”
Chevron Corporation 2015 Annual Report 21