Chevron 2015 Annual Report Download - page 65
Download and view the complete annual report
Please find page 65 of the 2015 Chevron annual report below. You can navigate through the pages in the report by either clicking on the pages listed below, or by using the keyword search tool below to find specific information within the annual report.-
 1
1 -
2
-
3
-
4
-
5
-
6
-
7
-
8
-
9
-
10
-
11
-
12
-
13
-
14
-
15
-
16
-
17
-
18
-
19
-
20
-
21
-
22
-
23
-
24
-
25
-
26
-
27
-
28
-
29
-
30
-
31
-
32
-
33
-
34
-
35
-
36
-
37
-
38
-
39
-
40
-
41
-
42
-
43
-
44
-
45
-
46
-
47
-
48
-
49
-
50
-
51
-
52
-
53
-
54
-
 55
55 -
 56
56 -
 57
57 -
 58
58 -
 59
59 -
 60
60 -
 61
61 -
 62
62 -
 63
63 -
 64
64 -
 65
65 -
 66
66 -
 67
67 -
 68
68 -
 69
69 -
 70
70 -
 71
71 -
 72
72 -
 73
73 -
 74
74 -
 75
75 -
76
-
77
-
78
-
79
-
80
-
81
-
82
-
83
-
84
-
85
-
86
-
87
-
88
 |
 |

Notes to the Consolidated Financial Statements
Millions of dollars, except per-share amounts
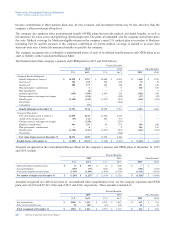
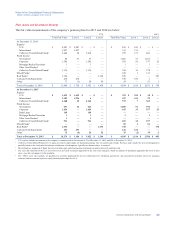
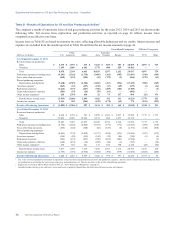
Plan Assets and Investment Strategy
The fair value measurements of the company’s pension plans for 2015 and 2014 are below:
U.S. Int’l.
Total Fair Value Level 1 Level 2 Level 3 Total Fair Value Level 1 Level 2 Level 3
At December 31, 2014
Equities
U.S.
1$ 2,087$ 2,087$ —$ — $ 241$ 241$ —$ —
International 1,297 1,297 — — 313 313 — —
Collective Trusts/Mutual Funds23,240 22 3,218 — 979 173 806 —
Fixed Income
Government 84 47 37 — 1,066 53 1,013 —
Corporate 1,502 — 1,502 — 585 26 537 22
Mortgage-Backed Securities 1 — 1 — 1 — 1 —
Other Asset Backed ———— ————
Collective Trusts/Mutual Funds21,174 — 1,174 — 394 16 378 —
Mixed Funds3———— 122 3119—
Real Estate41,364 — — 1,364 329 — — 329
Cash and Cash Equivalents 270 270 — — 190 189 1 —
Other571 (3)2054 24—213
Total at December 31, 2014 $ 11,090 $ 3,720 $ 5,952 $ 1,418 $ 4,244 $ 1,014 $ 2,876 $ 354
At December 31, 2015
Equities
U.S.1$ 1,699 $ 1,699 $ — $ — $ 392 $ 382 $ 10 $ —
International 1,302 1,296 6 — 457 435 22 —
Collective Trusts/Mutual Funds22,460 18 2,442 — 572 7 565 —
Fixed Income
Government 257 46 211 — 1,089 93 996 —
Corporate 1,654 — 1,654 — 615 33 557 25
Bank Loans 148 — 148 — — — — —
Mortgage-Backed Securities 1— 1— 1— 1—
Other Asset Backed 1— 1— ————
Collective Trusts/Mutual Funds2933 — 933 — 269 12 257 —
Mixed Funds3———— 85 481—
Real Estate41,494 — — 1,494 378 — — 378
Cash and Cash Equivalents 253 253 — — 232 232 — —
Other572 (6) 26 52 19 (2) 19 2
Total at December 31, 2015 $ 10,274 $ 3,306 $ 5,422 $ 1,546 $ 4,109 $ 1,196 $ 2,508 $ 405
1U.S. equities include investments in the company’s common stock in the amount of $9 at December 31, 2015, and $24 at December 31, 2014.
2Collective Trusts/Mutual Funds for U.S. plans are entirely index funds; for International plans, they are mostly index funds. For these index funds, the Level 2 designation is
partially based on the restriction that advance notification of redemptions, typically two business days, is required.
3Mixed funds are composed of funds that invest in both equity and fixed-income instruments in order to diversify and lower risk.
4The year-end valuations of the U.S. real estate assets are based on internal appraisals by the real estate managers, which are updates of third-party appraisals that occur at least
once a year for each property in the portfolio.
5The “Other” asset class includes net payables for securities purchased but not yet settled (Level 1); dividends and interest- and tax-related receivables (Level 2); insurance
contracts and investments in private-equity limited partnerships (Level 3).
Chevron Corporation 2015 Annual Report 63