Chevron 2015 Annual Report Download - page 42
Download and view the complete annual report
Please find page 42 of the 2015 Chevron annual report below. You can navigate through the pages in the report by either clicking on the pages listed below, or by using the keyword search tool below to find specific information within the annual report.-
 1
1 -
2
-
3
-
4
-
5
-
6
-
7
-
8
-
9
-
10
-
11
-
12
-
13
-
14
-
15
-
16
-
17
-
18
-
19
-
20
-
21
-
22
-
23
-
24
-
25
-
26
-
27
-
28
-
29
-
30
-
31
-
 32
32 -
 33
33 -
 34
34 -
 35
35 -
 36
36 -
 37
37 -
 38
38 -
 39
39 -
 40
40 -
 41
41 -
 42
42 -
 43
43 -
 44
44 -
 45
45 -
 46
46 -
 47
47 -
 48
48 -
 49
49 -
 50
50 -
 51
51 -
 52
52 -
53
-
54
-
55
-
56
-
57
-
58
-
59
-
60
-
61
-
62
-
63
-
64
-
65
-
66
-
67
-
68
-
69
-
70
-
71
-
72
-
73
-
74
-
75
-
76
-
77
-
78
-
79
-
80
-
81
-
82
-
83
-
84
-
85
-
86
-
87
-
88
 |
 |

Notes to the Consolidated Financial Statements
Millions of dollars, except per-share amounts
Refer also to Note 25, on page 67, for a discussion of revisions to the company’s AROs that also did not involve cash
receipts or payments for the three years ending December 31, 2015.
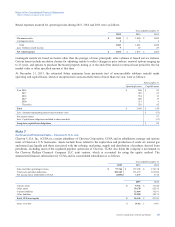
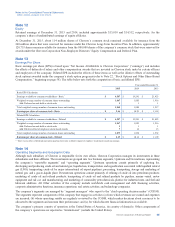
The major components of “Capital expenditures” and the reconciliation of this amount to the reported capital and exploratory
expenditures, including equity affiliates, are presented in the following table:
Year ended December 31
2015 2014 2013
Additions to properties, plant and equipment *$ 28,213 $ 34,393 $ 36,550
Additions to investments 555 526 934
Current-year dry hole expenditures 736 504 594
Payments for other liabilities and assets, net —(16) (93)
Capital expenditures 29,504 35,407 37,985
Expensed exploration expenditures 1,031 1,110 1,178
Assets acquired through capital lease obligations and other financing obligations 47 332 16
Capital and exploratory expenditures, excluding equity affiliates 30,582 36,849 39,179
Company’s share of expenditures by equity affiliates 3,397 3,467 2,698
Capital and exploratory expenditures, including equity affiliates $ 33,979 $ 40,316 $ 41,877
*Excludes noncash additions of $1,362 in 2015, $2,310 in 2014 and $1,661 in 2013.
Note 5
New Accounting Standards
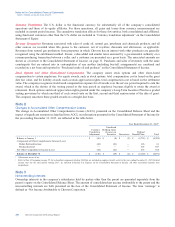
Revenue Recognition (Topic 606), Revenue from Contracts with Customers (ASU 2014-09) In July 2015, the FASB
approved a one-year deferral of the effective date of ASU 2014-09, which becomes effective for the company
January 1, 2018. Early adoption is permitted at the original effective date of January 1, 2017. The standard provides a single
comprehensive revenue recognition model for contracts with customers, eliminates most industry-specific revenue
recognition guidance, and expands disclosure requirements. The company is evaluating the effect of the standard on its
consolidated financial statements. The company does not intend to proceed with early adoption.
Income Taxes (Topic 740), Balance Sheet Classification of Deferred Taxes (ASU 2015-17) In November 2015, FASB
issued ASU 2015-17, which becomes effective for the company January 1, 2017. Early adoption is permitted. The standard
provides that all deferred income taxes be classified as noncurrent on the balance sheet. The current requirement is to classify
most deferred tax assets and liabilities based on the classification of the underlying asset or liability. Adoption of the standard
will not have an impact on the company’s results of operations or liquidity.
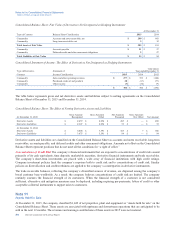
Note 6
Lease Commitments
Certain noncancelable leases are classified as capital leases, and the leased assets are included as part of “Properties, plant
and equipment, at cost” on the Consolidated Balance Sheet. Such leasing arrangements involve crude oil production and
processing equipment, service stations, bareboat charters, office buildings, and other facilities. Other leases are classified as
operating leases and are not capitalized. The payments on operating leases are recorded as expense. Details of the capitalized
leased assets are as follows:
At December 31
2015 2014
Upstream $ 800 $ 765
Downstream 98 97
All Other ——
Total 898 862
Less: Accumulated amortization 448 381
Net capitalized leased assets $ 450 $ 481
40 Chevron Corporation 2015 Annual Report