Chevron 2015 Annual Report Download - page 22
Download and view the complete annual report
Please find page 22 of the 2015 Chevron annual report below. You can navigate through the pages in the report by either clicking on the pages listed below, or by using the keyword search tool below to find specific information within the annual report.-
 1
1 -
2
-
3
-
4
-
5
-
6
-
7
-
8
-
9
-
10
-
11
-
 12
12 -
 13
13 -
 14
14 -
 15
15 -
 16
16 -
 17
17 -
 18
18 -
 19
19 -
 20
20 -
 21
21 -
 22
22 -
 23
23 -
 24
24 -
 25
25 -
 26
26 -
 27
27 -
 28
28 -
 29
29 -
 30
30 -
 31
31 -
 32
32 -
33
-
34
-
35
-
36
-
37
-
38
-
39
-
40
-
41
-
42
-
43
-
44
-
45
-
46
-
47
-
48
-
49
-
50
-
51
-
52
-
53
-
54
-
55
-
56
-
57
-
58
-
59
-
60
-
61
-
62
-
63
-
64
-
65
-
66
-
67
-
68
-
69
-
70
-
71
-
72
-
73
-
74
-
75
-
76
-
77
-
78
-
79
-
80
-
81
-
82
-
83
-
84
-
85
-
86
-
87
-
88
 |
 |
Management’s Discussion and Analysis of Financial Condition and Results of Operations
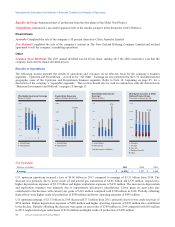
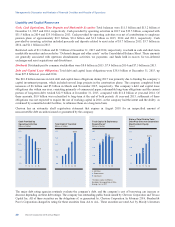
Liquidity and Capital Resources
Cash, Cash Equivalents, Time Deposits and Marketable Securities Total balances were $11.3 billion and $13.2 billion at
December 31, 2015 and 2014, respectively. Cash provided by operating activities in 2015 was $19.5 billion, compared with
$31.5 billion in 2014 and $35.0 billion in 2013. Cash provided by operating activities was net of contributions to employee
pension plans of approximately $0.9 billion, $0.4 billion and $1.2 billion in 2015, 2014 and 2013, respectively. Cash
provided by investing activities included proceeds and deposits related to asset sales of $5.7 billion in 2015, $5.7 billion in
2014, and $1.1 billion in 2013.
Restricted cash of $1.1 billion and $1.5 billion at December 31, 2015 and 2014, respectively, was held in cash and short-term
marketable securities and recorded as “Deferred charges and other assets” on the Consolidated Balance Sheet. These amounts
are generally associated with upstream abandonment activities, tax payments, and funds held in escrow for tax-deferred
exchanges and asset acquisitions and divestitures.
Dividends Dividends paid to common stockholders were $8.0 billion in 2015, $7.9 billion in 2014 and $7.5 billion in 2013.
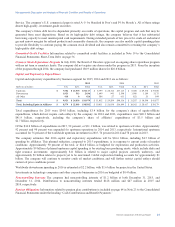
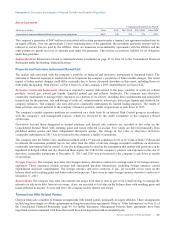
Debt and Capital Lease Obligations Total debt and capital lease obligations were $38.6 billion at December 31, 2015, up
from $27.8 billion at year-end 2014.
The $10.8 billion increase in total debt and capital lease obligations during 2015 was primarily due to funding the company’s
capital investment program, which included several large projects in the construction phase. The company completed bond
issuances of $6 billion and $5 billion in March and November 2015, respectively. The company’s debt and capital lease
obligations due within one year, consisting primarily of commercial paper, redeemable long-term obligations and the current
portion of long-term debt, totaled $12.9 billion at December 31, 2015, compared with $11.8 billion at year-end 2014. Of
these amounts, $8.0 billion was reclassified to long-term at the end of both periods. At year-end 2015, settlement of these
obligations was not expected to require the use of working capital in 2016, as the company had the intent and the ability, as
evidenced by committed credit facilities, to refinance them on a long-term basis.
Chevron has an automatic shelf registration statement that expires in August 2018 for an unspecified amount of
nonconvertible debt securities issued or guaranteed by the company.
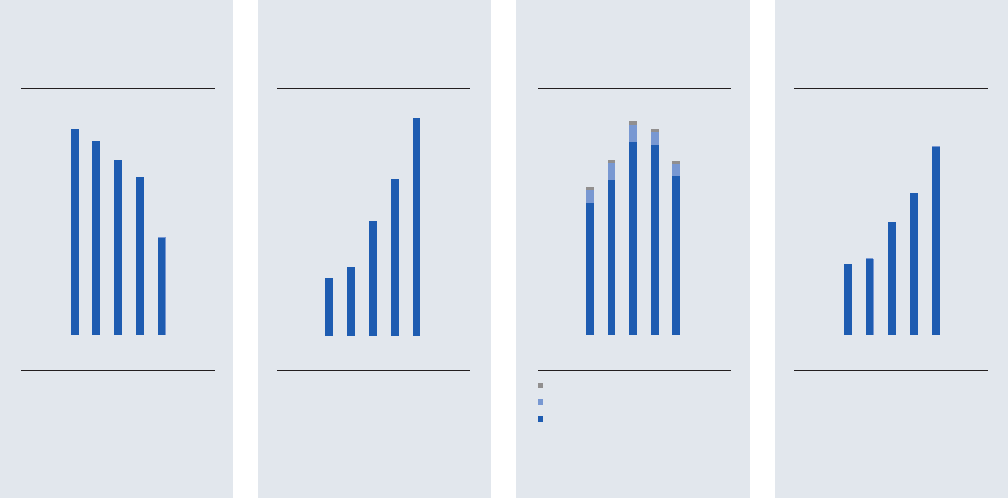
0.0
45.0
18.0
27.0
9.0
36.0
Cash Provided by
Operating Activities
Billions of dollars
1211 13 14 15
$19.5
0.0
40.0
32.0
8.0
16.0
24.0
Total Debt at Year-End
Billions of dollars
$38.6
1211 13 14 15
0.0
24.0
18.0
6.0
12.0
Ratio of Total Debt to Total
Debt-Plus-Chevron Corporation
Stockholders’ Equity
Percent
1211 13 14 15
20.2%
0.0
44.0
22.0
33.0
11.0
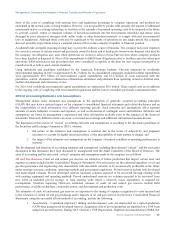
Total Capital & Exploratory
Expenditures*
Billions of dollars
All Other
Downstream
Upstream
*Includes equity in affiliates.
Excludes the acquisition of Atlas
Energy, Inc. in 2011.
1211 13 14 15
$34.0
The major debt rating agencies routinely evaluate the company’s debt, and the company’s cost of borrowing can increase or
decrease depending on these debt ratings. The company has outstanding public bonds issued by Chevron Corporation and Texaco
Capital Inc. All of these securities are the obligations of, or guaranteed by, Chevron Corporation. In February 2016, Standard &
Poor’s Corporation changed its rating for these securities from AA to AA-. These securities are rated Aa1 by Moody’s Investors
20 Chevron Corporation 2015 Annual Report