Chevron 2015 Annual Report Download - page 64
Download and view the complete annual report
Please find page 64 of the 2015 Chevron annual report below. You can navigate through the pages in the report by either clicking on the pages listed below, or by using the keyword search tool below to find specific information within the annual report.-
 1
1 -
2
-
3
-
4
-
5
-
6
-
7
-
8
-
9
-
10
-
11
-
12
-
13
-
14
-
15
-
16
-
17
-
18
-
19
-
20
-
21
-
22
-
23
-
24
-
25
-
26
-
27
-
28
-
29
-
30
-
31
-
32
-
33
-
34
-
35
-
36
-
37
-
38
-
39
-
40
-
41
-
42
-
43
-
44
-
45
-
46
-
47
-
48
-
49
-
50
-
51
-
52
-
53
-
 54
54 -
 55
55 -
 56
56 -
 57
57 -
 58
58 -
 59
59 -
 60
60 -
 61
61 -
 62
62 -
 63
63 -
 64
64 -
 65
65 -
 66
66 -
 67
67 -
 68
68 -
 69
69 -
 70
70 -
 71
71 -
 72
72 -
 73
73 -
 74
74 -
75
-
76
-
77
-
78
-
79
-
80
-
81
-
82
-
83
-
84
-
85
-
86
-
87
-
88
 |
 |

Notes to the Consolidated Financial Statements
Millions of dollars, except per-share amounts
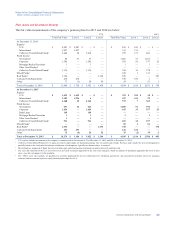
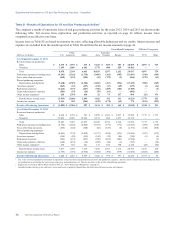
Assumptions The following weighted-average assumptions were used to determine benefit obligations and net periodic
benefit costs for years ended December 31:
Pension Benefits
2015 2014 2013 Other Benefits
U.S. Int’l. U.S. Int’l. U.S. Int’l. 2015 2014 2013
Assumptions used to determine benefit obligations:
Discount rate 4.0% 5.3% 3.7% 5.0% 4.3% 5.8% 4.6% 4.3% 4.9%
Rate of compensation increase 4.5% 4.8% 4.5% 5.1% 4.5% 5.5% N/A N/A N/A
Assumptions used to determine net periodic benefit
cost:
Discount rate 3.7% 5.0% 4.3% 5.8% 3.6% 5.2% 4.3% 4.9% 4.1%
Expected return on plan assets 7.5% 6.3% 7.5% 6.6% 7.5% 6.8% N/A N/A N/A
Rate of compensation increase 4.5% 5.1% 4.5% 5.5% 4.5% 5.5% N/A N/A N/A
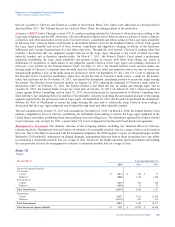
Expected Return on Plan Assets The company’s estimated long-term rates of return on pension assets are driven primarily
by actual historical asset-class returns, an assessment of expected future performance, advice from external actuarial firms
and the incorporation of specific asset-class risk factors. Asset allocations are periodically updated using pension plan asset/
liability studies, and the company’s estimated long-term rates of return are consistent with these studies.
For 2015, the company used an expected long-term rate of return of 7.5 percent for U.S. pension plan assets, which account
for 71 percent of the company’s pension plan assets. In both 2014 and 2013, the company used a long-term rate of return of
7.5 percent for this plan.
The market-related value of assets of the main U.S. pension plan used in the determination of pension expense was based on
the market values in the three months preceding the year-end measurement date. Management considers the three-month time
period long enough to minimize the effects of distortions from day-to-day market volatility and still be contemporaneous to
the end of the year. For other plans, market value of assets as of year-end is used in calculating the pension expense.
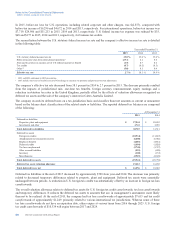
Discount Rate The discount rate assumptions used to determine the U.S. and international pension and OPEB plan
obligations and expense reflect the rate at which benefits could be effectively settled, and are equal to the equivalent single
rate resulting from yield curve analysis. This analysis considered the projected benefit payments specific to the company’s
plans and the yields on high-quality bonds. At December 31, 2015, the projected cash flows were discounted to the valuation
date using the yield curve for the main U.S. pension and OPEB plans. The effective discount rates derived from this analysis
were 4.0 percent for the main U.S. pension plan and 4.5 percent for the main U.S. OPEB plan. The discount rates for these
plans at the end of 2014 were 3.7 and 4.1 percent, respectively, while in 2013 they were 4.3 and 4.7 percent for these plans,
respectively.
The company changed the method used to estimate the service and interest costs associated with the company’s main U.S.
pension and OPEB plans. In prior years, the service and interest costs were estimated utilizing a single weighted-average
discount rate derived from the yield curve used to measure the defined benefit obligations at the beginning of the year. Under
the new method, these costs are estimated by applying spot rates along the yield curve to the relevant projected cash flows.
The change was made to provide a more precise measurement of the service and interest costs by improving the correlation
between projected benefit cash flows and the corresponding spot yield curve rates. This change in accounting estimate is
accounted for prospectively beginning with the year ending December 31, 2016. The company does not expect the change to
have a material effect on its consolidated financial position or liquidity.
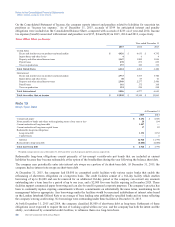
Other Benefit Assumptions For the measurement of accumulated postretirement benefit obligation at December 31, 2015,
for the main U.S. OPEB plan, the assumed health care cost-trend rates start with 7.1 percent in 2016 and gradually decline to
4.5 percent for 2025 and beyond. For this measurement at December 31, 2014, the assumed health care cost-trend rates
started with 7 percent in 2015 and gradually declined to 4.5 percent for 2025 and beyond. In both measurements, the annual
increase to company contributions was capped at 4 percent.
Assumed health care cost-trend rates can have a significant effect on the amounts reported for retiree health care costs. The
impact is mitigated by the 4 percent cap on the company’s medical contributions for the main U.S. plan. A 1-percentage-
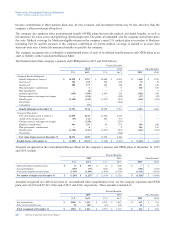
point change in the assumed health care cost-trend rates would have the following effects on worldwide plans:
1 Percent Increase 1 Percent Decrease
Effect on total service and interest cost components $ 20 $ (17)
Effect on postretirement benefit obligation $ 192 $ (164)
62 Chevron Corporation 2015 Annual Report