Chevron 2015 Annual Report Download - page 43
Download and view the complete annual report
Please find page 43 of the 2015 Chevron annual report below. You can navigate through the pages in the report by either clicking on the pages listed below, or by using the keyword search tool below to find specific information within the annual report.-
 1
1 -
2
-
3
-
4
-
5
-
6
-
7
-
8
-
9
-
10
-
11
-
12
-
13
-
14
-
15
-
16
-
17
-
18
-
19
-
20
-
21
-
22
-
23
-
24
-
25
-
26
-
27
-
28
-
29
-
30
-
31
-
32
-
 33
33 -
 34
34 -
 35
35 -
 36
36 -
 37
37 -
 38
38 -
 39
39 -
 40
40 -
 41
41 -
 42
42 -
 43
43 -
 44
44 -
 45
45 -
 46
46 -
 47
47 -
 48
48 -
 49
49 -
 50
50 -
 51
51 -
 52
52 -
 53
53 -
54
-
55
-
56
-
57
-
58
-
59
-
60
-
61
-
62
-
63
-
64
-
65
-
66
-
67
-
68
-
69
-
70
-
71
-
72
-
73
-
74
-
75
-
76
-
77
-
78
-
79
-
80
-
81
-
82
-
83
-
84
-
85
-
86
-
87
-
88
 |
 |

Notes to the Consolidated Financial Statements
Millions of dollars, except per-share amounts
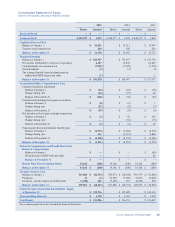
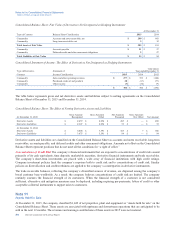
Rental expenses incurred for operating leases during 2015, 2014 and 2013 were as follows:
Year ended December 31
2015 2014 2013
Minimum rentals $ 1,041 $ 1,080 $ 1,049
Contingent rentals 211
Total 1,043 1,081 1,050
Less: Sublease rental income 91425
Net rental expense $ 1,034 $ 1,067 $ 1,025
Contingent rentals are based on factors other than the passage of time, principally sales volumes at leased service stations.
Certain leases include escalation clauses for adjusting rentals to reflect changes in price indices, renewal options ranging up
to 25 years, and options to purchase the leased property during or at the end of the initial or renewal lease period for the fair
market value or other specified amount at that time.
At December 31, 2015, the estimated future minimum lease payments (net of noncancelable sublease rentals) under
operating and capital leases, which at inception had a noncancelable term of more than one year, were as follows:
At December 31
Operating Leases Capital Leases
Year 2016 $ 846$ 23
2017 689 21
2018 554 19
2019 420 19
2020 311 6
Thereafter 528 62
Total $ 3,348 $ 150
Less: Amounts representing interest and executory costs $ (53)
Net present values 97
Less: Capital lease obligations included in short-term debt (17)
Long-term capital lease obligations $80
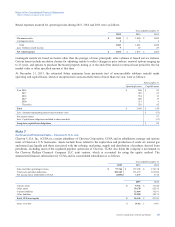
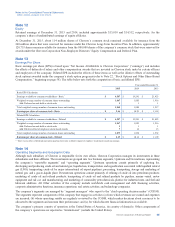
Note 7
Summarized Financial Data – Chevron U.S.A. Inc.
Chevron U.S.A. Inc. (CUSA) is a major subsidiary of Chevron Corporation. CUSA and its subsidiaries manage and operate
most of Chevron’s U.S. businesses. Assets include those related to the exploration and production of crude oil, natural gas
and natural gas liquids and those associated with the refining, marketing, supply and distribution of products derived from
petroleum, excluding most of the regulated pipeline operations of Chevron. CUSA also holds the company’s investment in
the Chevron Phillips Chemical Company LLC joint venture, which is accounted for using the equity method. The
summarized financial information for CUSA and its consolidated subsidiaries is as follows:
Year ended December 31
2015 2014 2013
Sales and other operating revenues $ 97,766 $ 157,198 $ 174,318
Total costs and other deductions 101,565 153,139 169,984
Net income (loss) attributable to CUSA (1,054) 3,849 3,714
2015 2014
Current assets $ 9,732 $ 13,724
Other assets 59,170 62,195
Current liabilities 13,664 16,191
Other liabilities 29,100 30,175
Total CUSA net equity $ 26,138 $ 29,553
Memo: Total debt $ 14,462 $ 14,473
Chevron Corporation 2015 Annual Report 41