Chevron 2015 Annual Report Download - page 6
Download and view the complete annual report
Please find page 6 of the 2015 Chevron annual report below. You can navigate through the pages in the report by either clicking on the pages listed below, or by using the keyword search tool below to find specific information within the annual report.-
 1
1 -
 2
2 -
 3
3 -
 4
4 -
 5
5 -
 6
6 -
 7
7 -
 8
8 -
 9
9 -
 10
10 -
 11
11 -
 12
12 -
 13
13 -
 14
14 -
 15
15 -
 16
16 -
 17
17 -
18
-
19
-
20
-
21
-
22
-
23
-
24
-
25
-
26
-
27
-
28
-
29
-
30
-
31
-
32
-
33
-
34
-
35
-
36
-
37
-
38
-
39
-
40
-
41
-
42
-
43
-
44
-
45
-
46
-
47
-
48
-
49
-
50
-
51
-
52
-
53
-
54
-
55
-
56
-
57
-
58
-
59
-
60
-
61
-
62
-
63
-
64
-
65
-
66
-
67
-
68
-
69
-
70
-
71
-
72
-
73
-
74
-
75
-
76
-
77
-
78
-
79
-
80
-
81
-
82
-
83
-
84
-
85
-
86
-
87
-
88
 |
 |

Chevron Corporation 2015 Annual Report
4
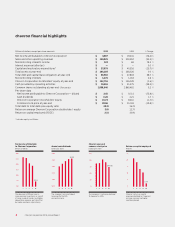
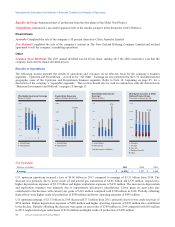
chevron financial highlights
0.0
30.0
20.0
15.0
5.0
10.0
25.0
Millions of dollars, except per-share amounts
Net income attributable
to Chevron Corporation
Billions of dollars
The decrease in 2015 was due to
lower earnings in upstream as a result
of lower crude oil margins and higher
depreciation expense, partially oset
by higher earnings in downstream.
11 13 14 15
$4.6
12
0.00
5.00
4.00
3.00
1.00
2.00
Annual cash dividends
Dollars per share
The company’s annual dividend
increased for the 28th
consecutive year.
12
11 13 14 15
$4.28
0
150
120
90
60
30
Chevron year-end
common stock price
Dollars per share
The company’s stock price declined
19.8 percent in 2015.
1211 13 14 15
$89.96
0
25
20
15
10
5
Return on capital employed
Percent
Chevron’s return on capital
employed declined to 2.5 percent
on lower earnings and higher
capital employed.
1211 13 14 15
2.5%
Change
Net income attributable to Chevron Corporation ()
Sales and other operating revenues ()
Noncontrolling interests income
Interest expense (after tax) — —
Capital and exploratory expenditures* ()
Total assets at year-end
Total debt and capital lease obligations at year-end
Noncontrolling interests
Chevron Corporation stockholders’ equity at year-end ()
Cash provided by operating activities ()
Common shares outstanding at year-end (Thousands)
Per-share data
Net income attributable to Chevron Corporation — diluted ()
Cash dividends
Chevron Corporation stockholders’ equity ()
Common stock price at year-end ()
Total debt to total debt-plus-equity ratio
Return on average Chevron Corporation stockholders’ equity
Return on capital employed (ROCE)
* Includes equity in aliates
4 Chevron Corporation 2015 Annual Report