Chevron 2015 Annual Report Download - page 4
Download and view the complete annual report
Please find page 4 of the 2015 Chevron annual report below. You can navigate through the pages in the report by either clicking on the pages listed below, or by using the keyword search tool below to find specific information within the annual report.-
 1
1 -
 2
2 -
 3
3 -
 4
4 -
 5
5 -
 6
6 -
 7
7 -
 8
8 -
 9
9 -
 10
10 -
 11
11 -
 12
12 -
 13
13 -
 14
14 -
 15
15 -
16
-
17
-
18
-
19
-
20
-
21
-
22
-
23
-
24
-
25
-
26
-
27
-
28
-
29
-
30
-
31
-
32
-
33
-
34
-
35
-
36
-
37
-
38
-
39
-
40
-
41
-
42
-
43
-
44
-
45
-
46
-
47
-
48
-
49
-
50
-
51
-
52
-
53
-
54
-
55
-
56
-
57
-
58
-
59
-
60
-
61
-
62
-
63
-
64
-
65
-
66
-
67
-
68
-
69
-
70
-
71
-
72
-
73
-
74
-
75
-
76
-
77
-
78
-
79
-
80
-
81
-
82
-
83
-
84
-
85
-
86
-
87
-
88
 |
 |

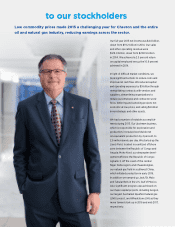
Low commodity prices made 2015 a challenging year for Chevron and the entire
oil and natural gas industry, reducing earnings across the sector.
to our stockholders
Our full-year
2015
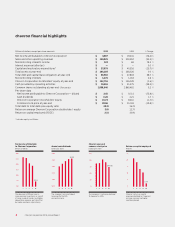
net income was $4.6 billion,
down from $19.2 billion in 2014. Our sales
and other operating revenue were
$129.9 billion, down from $200.5 billion
in 2014. We achieved a 2.5 percent return
on capital employed versus the 10.9 percent
achieved in 2014.
In light of dicult market conditions, we
took significant actions to reduce costs and
improve net cash flow. We reduced capital
and operating expenses by $9 billion through
renegotiating contracts with vendors and
suppliers, streamlining organizations to
reduce our employee and contractor work-
force, deferring and canceling projects not
economic at low prices, and selling $6 billion
in nonstrategic and other assets.
We had a number of notable accomplish-
ments during
2015
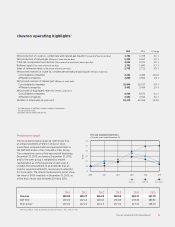
. Our Upstream business,
which is responsible for exploration and
production, increased worldwide net
oil-equivalent production by 2 percent, to
2.6 million barrels per day. We started up the
Lianzi Field, located in a unitized oshore
zone between the Republic of Congo and
Angola; Moho Nord, our deepwater devel-
opment oshore the Republic of Congo;
Agbami 3, o the coast of the central
Niger Delta region; and Chuandongbei,
our natural gas field in southwest China,
which initiated production in early 2016.
In addition we ramped up Jack/St. Malo
and Tubular Bells in the U.S. Gulf of Mexico.
Also significant progress was achieved on
our major capital projects, including Gorgon,
our largest Australian liquefied natural gas
(LNG) project, and Wheatstone LNG as they
move toward start-up in 2016 and mid-2017,
respectively.