Chevron 2015 Annual Report Download - page 47
Download and view the complete annual report
Please find page 47 of the 2015 Chevron annual report below. You can navigate through the pages in the report by either clicking on the pages listed below, or by using the keyword search tool below to find specific information within the annual report.-
 1
1 -
2
-
3
-
4
-
5
-
6
-
7
-
8
-
9
-
10
-
11
-
12
-
13
-
14
-
15
-
16
-
17
-
18
-
19
-
20
-
21
-
22
-
23
-
24
-
25
-
26
-
27
-
28
-
29
-
30
-
31
-
32
-
33
-
34
-
35
-
36
-
 37
37 -
 38
38 -
 39
39 -
 40
40 -
 41
41 -
 42
42 -
 43
43 -
 44
44 -
 45
45 -
 46
46 -
 47
47 -
 48
48 -
 49
49 -
 50
50 -
 51
51 -
 52
52 -
 53
53 -
 54
54 -
 55
55 -
 56
56 -
 57
57 -
58
-
59
-
60
-
61
-
62
-
63
-
64
-
65
-
66
-
67
-
68
-
69
-
70
-
71
-
72
-
73
-
74
-
75
-
76
-
77
-
78
-
79
-
80
-
81
-
82
-
83
-
84
-
85
-
86
-
87
-
88
 |
 |

Notes to the Consolidated Financial Statements
Millions of dollars, except per-share amounts
Note 12
Equity
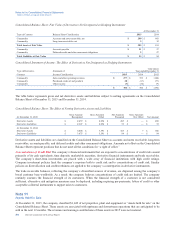
Retained earnings at December 31, 2015 and 2014, included approximately $15,010 and $14,512, respectively, for the
company’s share of undistributed earnings of equity affiliates.
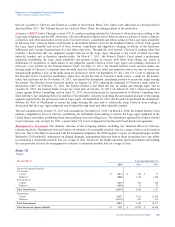
At December 31, 2015, about 114 million shares of Chevron’s common stock remained available for issuance from the
260 million shares that were reserved for issuance under the Chevron Long-Term Incentive Plan. In addition, approximately
120,753 shares remain available for issuance from the 800,000 shares of the company’s common stock that were reserved for
awards under the Chevron Corporation Non-Employee Directors’ Equity Compensation and Deferral Plan.
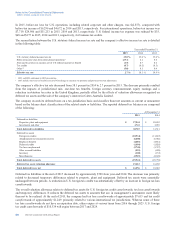
Note 13
Earnings Per Share
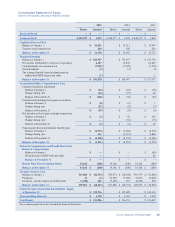
Basic earnings per share (EPS) is based upon “Net Income Attributable to Chevron Corporation” (“earnings”) and includes
the effects of deferrals of salary and other compensation awards that are invested in Chevron stock units by certain officers
and employees of the company. Diluted EPS includes the effects of these items as well as the dilutive effects of outstanding
stock options awarded under the company’s stock option programs (refer to Note 22, “Stock Options and Other Share-Based
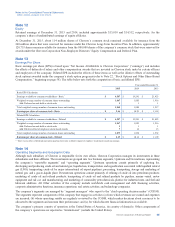
Compensation,” beginning on page 58). The table below sets forth the computation of basic and diluted EPS:
Year ended December 31
2015 2014 2013
Basic EPS Calculation
Earnings available to common stockholders - Basic*$ 4,587 $ 19,241 $ 21,423
Weighted-average number of common shares outstanding 1,867 1,883 1,916
Add: Deferred awards held as stock units 111
Total weighted-average number of common shares outstanding 1,868 1,884 1,917
Earnings per share of common stock - Basic $ 2.46 $ 10.21 $ 11.18
Diluted EPS Calculation
Earnings available to common stockholders - Diluted*$ 4,587 $ 19,241 $ 21,423
Weighted-average number of common shares outstanding 1,867 1,883 1,916
Add: Deferred awards held as stock units 111
Add: Dilutive effect of employee stock-based awards 714 15
Total weighted-average number of common shares outstanding 1,875 1,898 1,932
Earnings per share of common stock - Diluted $ 2.45 $ 10.14 $ 11.09
* There was no effect of dividend equivalents paid on stock units or dilutive impact of employee stock-based awards on earnings.
Note 14
Operating Segments and Geographic Data
Although each subsidiary of Chevron is responsible for its own affairs, Chevron Corporation manages its investments in these
subsidiaries and their affiliates. The investments are grouped into two business segments, Upstream and Downstream, representing
the company’s “reportable segments” and “operating segments.” Upstream operations consist primarily of exploring for,
developing and producing crude oil and natural gas; liquefaction, transportation and regasification associated with liquefied natural
gas (LNG); transporting crude oil by major international oil export pipelines; processing, transporting, storage and marketing of
natural gas; and a gas-to-liquids plant. Downstream operations consist primarily of refining of crude oil into petroleum products;
marketing of crude oil and refined products; transporting of crude oil and refined products by pipeline, marine vessel, motor
equipment and rail car; and manufacturing and marketing of commodity petrochemicals, plastics for industrial uses, and fuel and
lubricant additives. All Other activities of the company include worldwide cash management and debt financing activities,
corporate administrative functions, insurance operations, real estate activities, and technology companies.
The company’s segments are managed by “segment managers” who report to the “chief operating decision maker” (CODM).
The segments represent components of the company that engage in activities (a) from which revenues are earned and expenses
are incurred; (b) whose operating results are regularly reviewed by the CODM, which makes decisions about resources to be
allocated to the segments and assesses their performance; and (c) for which discrete financial information is available.
The company’s primary country of operation is the United States of America, its country of domicile. Other components of
the company’s operations are reported as “International” (outside the United States).
Chevron Corporation 2015 Annual Report 45