Chevron 2015 Annual Report Download - page 49
Download and view the complete annual report
Please find page 49 of the 2015 Chevron annual report below. You can navigate through the pages in the report by either clicking on the pages listed below, or by using the keyword search tool below to find specific information within the annual report.-
 1
1 -
2
-
3
-
4
-
5
-
6
-
7
-
8
-
9
-
10
-
11
-
12
-
13
-
14
-
15
-
16
-
17
-
18
-
19
-
20
-
21
-
22
-
23
-
24
-
25
-
26
-
27
-
28
-
29
-
30
-
31
-
32
-
33
-
34
-
35
-
36
-
37
-
38
-
 39
39 -
 40
40 -
 41
41 -
 42
42 -
 43
43 -
 44
44 -
 45
45 -
 46
46 -
 47
47 -
 48
48 -
 49
49 -
 50
50 -
 51
51 -
 52
52 -
 53
53 -
 54
54 -
 55
55 -
 56
56 -
 57
57 -
 58
58 -
 59
59 -
60
-
61
-
62
-
63
-
64
-
65
-
66
-
67
-
68
-
69
-
70
-
71
-
72
-
73
-
74
-
75
-
76
-
77
-
78
-
79
-
80
-
81
-
82
-
83
-
84
-
85
-
86
-
87
-
88
 |
 |

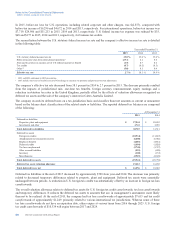
Notes to the Consolidated Financial Statements
Millions of dollars, except per-share amounts
Year ended December 31
2015 2014 2013
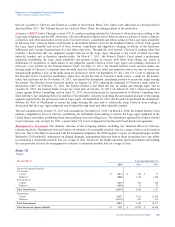
Upstream
United States $ 4,117 $ 7,455 $ 8,052
Intersegment 8,631 15,455 16,865
Total United States 12,748 22,910 24,917
International 15,587 23,808 17,607
Intersegment 11,492 23,107 33,034
Total International 27,079 46,915 50,641
Total Upstream*39,827 69,825 75,558
Downstream
United States 48,420 73,942 80,272
Excise and similar taxes 4,426 4,633 4,792
Intersegment 26 31 39
Total United States 52,872 78,606 85,103
International 54,296 86,848 105,373
Excise and similar taxes 2,933 3,553 3,699
Intersegment 1,528 8,839 859
Total International 58,757 99,240 109,931
Total Downstream*111,629 177,846 195,034
All Other
United States 141 252 358
Intersegment 1,372 1,475 1,524
Total United States 1,513 1,727 1,882
International 533
Intersegment 37 28 31
Total International 42 31 34
Total All Other 1,555 1,758 1,916
Segment Sales and Other Operating Revenues
United States 67,133 103,243 111,902
International 85,878 146,186 160,606
Total Segment Sales and Other Operating Revenues 153,011 249,429 272,508
Elimination of intersegment sales (23,086) (48,935) (52,352)
Total Sales and Other Operating Revenues $ 129,925 $ 200,494 $ 220,156
*Effective January 1, 2014, International Upstream prospectively includes selected amounts previously recognized in International Downstream, which are not material to the
segments.
Segment Income Taxes Segment income tax expense for the years 2015, 2014 and 2013 is as follows:
Year ended December 31
2015 2014 2013
Upstream
United States $ (2,041) $ 2,043 $ 2,333
International 1,214 9,217 12,470
Total Upstream (827) 11,260 14,803
Downstream
United States 1,320 1,302 364
International 1,313 467 389
Total Downstream 2,633 1,769 753
All Other (1,674) (1,137) (1,248)
Total Income Tax Expense $ 132 $ 11,892 $ 14,308
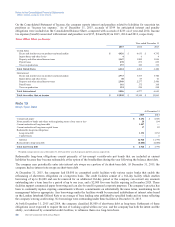
Other Segment Information Additional information for the segmentation of major equity affiliates is contained in Note 15,
on page 48. Information related to properties, plant and equipment by segment is contained in Note 16, on page 49.
Chevron Corporation 2015 Annual Report 47