Chevron 2015 Annual Report Download - page 24
Download and view the complete annual report
Please find page 24 of the 2015 Chevron annual report below. You can navigate through the pages in the report by either clicking on the pages listed below, or by using the keyword search tool below to find specific information within the annual report.-
 1
1 -
2
-
3
-
4
-
5
-
6
-
7
-
8
-
9
-
10
-
11
-
12
-
13
-
 14
14 -
 15
15 -
 16
16 -
 17
17 -
 18
18 -
 19
19 -
 20
20 -
 21
21 -
 22
22 -
 23
23 -
 24
24 -
 25
25 -
 26
26 -
 27
27 -
 28
28 -
 29
29 -
 30
30 -
 31
31 -
 32
32 -
 33
33 -
 34
34 -
35
-
36
-
37
-
38
-
39
-
40
-
41
-
42
-
43
-
44
-
45
-
46
-
47
-
48
-
49
-
50
-
51
-
52
-
53
-
54
-
55
-
56
-
57
-
58
-
59
-
60
-
61
-
62
-
63
-
64
-
65
-
66
-
67
-
68
-
69
-
70
-
71
-
72
-
73
-
74
-
75
-
76
-
77
-
78
-
79
-
80
-
81
-
82
-
83
-
84
-
85
-
86
-
87
-
88
 |
 |

Management’s Discussion and Analysis of Financial Condition and Results of Operations
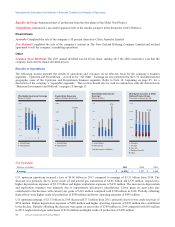
Financial Ratios
At December 31
2015 2014 2013
Current Ratio 1.3 1.3 1.5
Interest Coverage Ratio 9.9 87.2 126.2
Debt Ratio 20.2 % 15.2 % 12.1 %
Current Ratio Current assets divided by current liabilities, which indicates the company’s ability to repay its short-term
liabilities with short-term assets. The current ratio in all periods was adversely affected by the fact that Chevron’s inventories
are valued on a last-in, first-out basis. At year-end 2015, the book value of inventory was lower than replacement costs,
based on average acquisition costs during the year, by approximately $3.7 billion.
Interest Coverage Ratio Income before income tax expense, plus interest and debt expense and amortization of capitalized
interest, less net income attributable to noncontrolling interests, divided by before-tax interest costs. This ratio indicates the
company’s ability to pay interest on outstanding debt. The company’s interest coverage ratio in 2015 was lower than 2014
and 2013 due to lower income.
Debt Ratio Total debt as a percentage of total debt plus Chevron Corporation Stockholders’ Equity, which indicates the
company’s leverage. The company’s debt ratio in 2015 was higher than 2014 and 2013 as the company took on more debt to
finance its ongoing investment program.
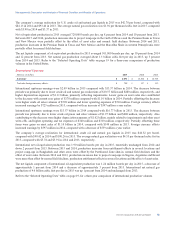
Off-Balance-Sheet Arrangements, Contractual Obligations, Guarantees and Other Contingencies
Long-Term Unconditional Purchase Obligations and Commitments, Including Throughput and Take-or-Pay Agreements
The company and its subsidiaries have certain contingent liabilities with respect to long-term unconditional purchase
obligations and commitments, including throughput and take-or-pay agreements, some of which relate to suppliers’ financing
arrangements. The agreements typically provide goods and services, such as pipeline and storage capacity, drilling rigs,
utilities, and petroleum products, to be used or sold in the ordinary course of the company’s business. The aggregate
approximate amounts of required payments under these various commitments are: 2016 – $2.1 billion; 2017 – $1.9 billion;
2018 – $1.7 billion; 2019 – $1.5 billion; 2020 – $1.1 billion; 2020 and after – $3.1 billion. A portion of these commitments
may ultimately be shared with project partners. Total payments under the agreements were approximately $1.9 billion in
2015, $3.7 billion in 2014 and $3.6 billion in 2013.
The following table summarizes the company’s significant contractual obligations:
Payments Due by Period
Millions of dollars Total12016 2017-2018 2019-2020 After 2020
On Balance Sheet:2
Short-Term Debt3$ 4,928 $4,928 $ — $ — $ —
Long-Term Debt333,584 — 20,023 6,704 6,857
Noncancelable Capital Lease Obligations 150 23 40 25 62
Interest 3,052 563 994 615 880
Off Balance Sheet:
Noncancelable Operating Lease Obligations 3,348 846 1,243 731 528
Throughput and Take-or-Pay Agreements46,042 634 1,352 1,294 2,762
Other Unconditional Purchase Obligations45,293 1,480 2,228 1,276 309
1Excludes contributions for pensions and other postretirement benefit plans. Information on employee benefit plans is contained in Note 23 beginning on page 59.
2Does not include amounts related to the company’s income tax liabilities associated with uncertain tax positions. The company is unable to make reasonable estimates of the
periods in which such liabilities may become payable. The company does not expect settlement of such liabilities to have a material effect on its consolidated financial position
or liquidity in any single period.
3$8.0 billion of short-term debt that the company expects to refinance is included in long-term debt. The repayment schedule above reflects the projected repayment of the entire
amounts in the 2017–2018 period.
4Does not include commodity purchase obligations that are not fixed or determinable. These obligations are generally monetized in a relatively short period of time through
sales transactions or similar agreements with third parties. Examples include obligations to purchase LNG, regasified natural gas and refinery products at indexed prices.
22 Chevron Corporation 2015 Annual Report