Chevron 2015 Annual Report Download - page 19
Download and view the complete annual report
Please find page 19 of the 2015 Chevron annual report below. You can navigate through the pages in the report by either clicking on the pages listed below, or by using the keyword search tool below to find specific information within the annual report.-
 1
1 -
2
-
3
-
4
-
5
-
6
-
7
-
8
-
 9
9 -
 10
10 -
 11
11 -
 12
12 -
 13
13 -
 14
14 -
 15
15 -
 16
16 -
 17
17 -
 18
18 -
 19
19 -
 20
20 -
 21
21 -
 22
22 -
 23
23 -
 24
24 -
 25
25 -
 26
26 -
 27
27 -
 28
28 -
 29
29 -
30
-
31
-
32
-
33
-
34
-
35
-
36
-
37
-
38
-
39
-
40
-
41
-
42
-
43
-
44
-
45
-
46
-
47
-
48
-
49
-
50
-
51
-
52
-
53
-
54
-
55
-
56
-
57
-
58
-
59
-
60
-
61
-
62
-
63
-
64
-
65
-
66
-
67
-
68
-
69
-
70
-
71
-
72
-
73
-
74
-
75
-
76
-
77
-
78
-
79
-
80
-
81
-
82
-
83
-
84
-
85
-
86
-
87
-
88
 |
 |

Management’s Discussion and Analysis of Financial Condition and Results of Operations
Consolidated Statement of Income
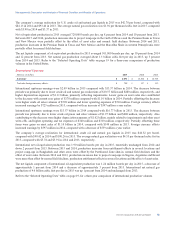
Comparative amounts for certain income statement categories are shown below:
Millions of dollars 2015 2014 2013
Sales and other operating revenues $ 129,925 $ 200,494 $ 220,156
Sales and other operating revenues decreased in 2015 primarily due to lower refined product and crude oil prices, partially
offset by an increase in refined product and crude oil volumes. The decrease between 2014 and 2013 was mainly due to
lower crude oil volumes, and lower refined product and crude oil prices.
Millions of dollars 2015 2014 2013
Income from equity affiliates $ 4,684 $ 7,098 $ 7,527
Income from equity affiliates decreased in 2015 from 2014 mainly due to lower earnings from Tengizchevroil in Kazakhstan,
CPChem, Angola LNG and the effect of the sale of Caltex Australia Limited in second quarter 2015. Partially offsetting
these effects were higher earnings from GS Caltex in South Korea and Petropiar in Venezuela.
Income from equity affiliates decreased in 2014 from 2013 mainly due to lower upstream-related earnings from
Tengizchevroil in Kazakhstan, Petropiar and Petroboscan in Venezuela, and Angola LNG. Partially offsetting these effects
were higher downstream-related earnings from GS Caltex in South Korea, higher earnings from CPChem and the absence of
2013 impairments of power-related affiliates.
Refer to Note 15, beginning on page 48, for a discussion of Chevron’s investments in affiliated companies.
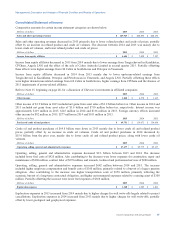
Millions of dollars 2015 2014 2013
Other income $ 3,868 $ 4,378 $ 1,165
Other income of $3.9 billion in 2015 included net gains from asset sales of $3.2 billion before-tax. Other income in 2014 and
2013 included net gains from asset sales of $3.6 billion and $710 million before-tax, respectively. Interest income was
approximately $119 million in 2015, $145 million in 2014 and $136 million in 2013. Foreign currency effects increased
other income by $82 million in 2015, $277 million in 2014 and $103 million in 2013.
Millions of dollars 2015 2014 2013
Purchased crude oil and products $ 69,751 $ 119,671 $ 134,696
Crude oil and product purchases of $69.8 billion were down in 2015 mainly due to lower crude oil and refined product
prices, partially offset by an increase in crude oil volumes. Crude oil and product purchases in 2014 decreased by
$15.0 billion from the prior year, mainly due to lower crude oil and refined product prices, along with lower crude oil
volumes.
Millions of dollars 2015 2014 2013
Operating, selling, general and administrative expenses $ 27,477 $ 29,779 $ 29,137
Operating, selling, general and administrative expenses decreased $2.3 billion between 2015 and 2014. The decrease
included lower fuel costs of $920 million. Also contributing to the decrease were lower expenses for construction, repair and
maintenance of $300 million, contract labor of $270 million, and research, technical and professional services of $200 million.
Operating, selling, general and administrative expenses increased $642 million between 2014 and 2013. The increase
included higher employee compensation and benefit costs of $360 million, primarily related to a buyout of a legacy pension
obligation. Also contributing to the increase was higher transportation costs of $350 million, primarily reflecting the
economic buyout of a long-term contractual obligation, and higher environmental expenses related to a mining asset of $300
million. Partially offsetting the increase were lower fuel expenses of $360 million.
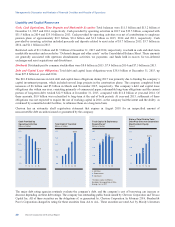
Millions of dollars 2015 2014 2013
Exploration expense $ 3,340 $ 1,985 $ 1,861
Exploration expenses in 2015 increased from 2014 mainly due to higher charges for well write-offs largely related to project
cancellations. Exploration expenses in 2014 increased from 2013 mainly due to higher charges for well write-offs, partially
offset by lower geological and geophysical expenses.
Chevron Corporation 2015 Annual Report 17