Chevron 2015 Annual Report Download - page 41
Download and view the complete annual report
Please find page 41 of the 2015 Chevron annual report below. You can navigate through the pages in the report by either clicking on the pages listed below, or by using the keyword search tool below to find specific information within the annual report.-
 1
1 -
2
-
3
-
4
-
5
-
6
-
7
-
8
-
9
-
10
-
11
-
12
-
13
-
14
-
15
-
16
-
17
-
18
-
19
-
20
-
21
-
22
-
23
-
24
-
25
-
26
-
27
-
28
-
29
-
30
-
 31
31 -
 32
32 -
 33
33 -
 34
34 -
 35
35 -
 36
36 -
 37
37 -
 38
38 -
 39
39 -
 40
40 -
 41
41 -
 42
42 -
 43
43 -
 44
44 -
 45
45 -
 46
46 -
 47
47 -
 48
48 -
 49
49 -
 50
50 -
 51
51 -
52
-
53
-
54
-
55
-
56
-
57
-
58
-
59
-
60
-
61
-
62
-
63
-
64
-
65
-
66
-
67
-
68
-
69
-
70
-
71
-
72
-
73
-
74
-
75
-
76
-
77
-
78
-
79
-
80
-
81
-
82
-
83
-
84
-
85
-
86
-
87
-
88
 |
 |

Notes to the Consolidated Financial Statements
Millions of dollars, except per-share amounts
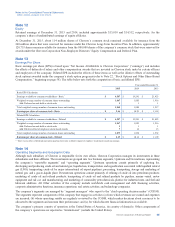
Activity for the equity attributable to noncontrolling interests for 2015, 2014 and 2013 is as follows:
2015 2014 2013
Balance at January 1 $ 1,163 $ 1,314 $ 1,308
Net income 123 69 174
Distributions to noncontrolling interests (128) (47) (99)
Other changes, net 12 (173) (69)
Balance at December 31 $ 1,170 $ 1,163 $ 1,314
Note 4
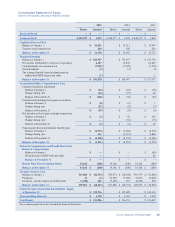
Information Relating to the Consolidated Statement of Cash Flows
Year ended December 31
2015 2014 2013
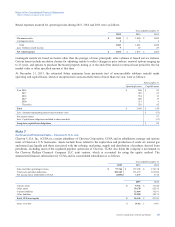
Net increase in operating working capital was composed of the following:
Decrease (increase) in accounts and notes receivable $ 3,631 $ 4,491 $ (1,101)
Decrease (increase) in inventories 85 (146) (237)
Decrease (increase) in prepaid expenses and other current assets 713 (407) 834
(Decrease) increase in accounts payable and accrued liabilities (5,769) (3,737) 160
Decrease in income and other taxes payable (639) (741) (987)
Net increase in operating working capital $ (1,979) $ (540) $ (1,331)
Net cash provided by operating activities includes the following cash payments for income taxes:
Income taxes $ 4,645 $ 10,562 $ 12,898
Net sales (purchases) of marketable securities consisted of the following gross amounts:
Marketable securities purchased $(6)$ (162) $ (7)
Marketable securities sold 128 14 10
Net sales (purchases) of marketable securities $ 122 $ (148) $ 3
Net maturities of time deposits consisted of the following gross amounts:
Investments in time deposits $—$ (317) $ (2,317)
Maturities of time deposits 8317 3,017
Net maturities of time deposits $ 8 $ — $ 700
Net (repayments) borrowings of short-term obligations consisted of the following gross and net
amounts:
Proceeds from issuances of short-term obligations $ 13,805 $ 9,070 $ 1,551
Repayments of short-term obligations (16,379) (4,612) (375)
Net borrowings (repayments) of short-term obligations with three months or less maturity 2,239 (1,027) 1,202
Net (repayments) borrowings of short-term obligations $ (335) $ 3,431 $ 2,378
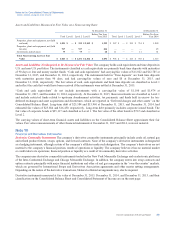
The “Net increase in operating working capital” includes reductions of $17, $58 and $79 for excess income tax benefits
associated with stock options exercised during 2015, 2014 and 2013, respectively. These amounts are offset by an equal
amount in “Net sales (purchases) of treasury shares.” “Other” includes changes in postretirement benefits obligations and
other long-term liabilities.
The “Net sales (purchases) of treasury shares” represents the cost of common shares acquired less the cost of shares issued
for share-based compensation plans. Purchases totaled $2, $5,006 and $5,004 in 2015, 2014 and 2013, respectively. No
purchases were made under the company’s share repurchase program in 2015. In 2014 and 2013, the company purchased
41.5 million and 41.6 million common shares for $5,000 and $5,000 under its share repurchase program, respectively.
In 2015, 2014 and 2013, “Net sales (purchases) of other short-term investments” generally consisted of restricted cash
associated with upstream abandonment activities, tax payments, and funds held in escrow for tax-deferred exchanges and
asset acquisitions and divestitures that was invested in cash and short-term securities and reclassified from “Cash and cash
equivalents” to “Deferred charges and other assets” on the Consolidated Balance Sheet.
The Consolidated Statement of Cash Flows excludes changes to the Consolidated Balance Sheet that did not affect cash.
“Depreciation, depletion and amortization,” “Dry hole expense” and “Deferred income tax provision” collectively include
approximately $3,700 in non-cash reductions to properties, plant and equipment recorded in 2015 relating to impairments
and project suspensions and associated adverse tax effects, primarily as a result of downward revisions in the company’s
longer-term crude oil price outlook.
Chevron Corporation 2015 Annual Report 39