Chevron 2015 Annual Report Download - page 70
Download and view the complete annual report
Please find page 70 of the 2015 Chevron annual report below. You can navigate through the pages in the report by either clicking on the pages listed below, or by using the keyword search tool below to find specific information within the annual report.-
 1
1 -
2
-
3
-
4
-
5
-
6
-
7
-
8
-
9
-
10
-
11
-
12
-
13
-
14
-
15
-
16
-
17
-
18
-
19
-
20
-
21
-
22
-
23
-
24
-
25
-
26
-
27
-
28
-
29
-
30
-
31
-
32
-
33
-
34
-
35
-
36
-
37
-
38
-
39
-
40
-
41
-
42
-
43
-
44
-
45
-
46
-
47
-
48
-
49
-
50
-
51
-
52
-
53
-
54
-
55
-
56
-
57
-
58
-
59
-
 60
60 -
 61
61 -
 62
62 -
 63
63 -
 64
64 -
 65
65 -
 66
66 -
 67
67 -
 68
68 -
 69
69 -
 70
70 -
 71
71 -
 72
72 -
 73
73 -
 74
74 -
 75
75 -
 76
76 -
 77
77 -
 78
78 -
 79
79 -
 80
80 -
81
-
82
-
83
-
84
-
85
-
86
-
87
-
88
 |
 |

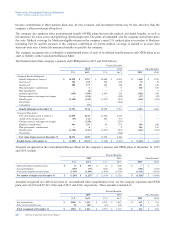
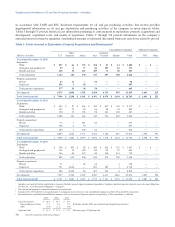
Notes to the Consolidated Financial Statements
Millions of dollars, except per-share amounts
Other financial information is as follows:
Year ended December 31
2015 2014 2013
Total financing interest and debt costs $ 495 $ 358 $ 284
Less: Capitalized interest 495 358 284
Interest and debt expense $—$—$—
Research and development expenses $ 601 $ 707 $ 750
Excess of replacement cost over the carrying value of inventories (LIFO method) 3,745 8,135 9,150
LIFO (losses) / profits on inventory drawdowns included in earnings (65) 13 14
Foreign currency effects* $ 769 $ 487 $ 474
*Includes $344, $118 and $244 in 2015, 2014 and 2013, respectively, for the company’s share of equity affiliates’ foreign currency effects.
The company has $4,588 in goodwill on the Consolidated Balance Sheet related to the 2005 acquisition of Unocal and to the
2011 acquisition of Atlas Energy, Inc. The company tested this goodwill for impairment during 2015 and concluded no
impairment was necessary.
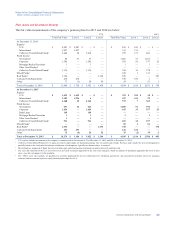
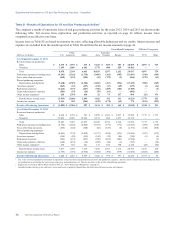
Five-Year Financial Summary
Unaudited
Millions of dollars, except per-share amounts 2015 2014 2013 2012 2011
Statement of Income Data
Revenues and Other Income
Total sales and other operating revenues*$ 129,925 $ 200,494 $ 220,156 $ 230,590 $ 244,371
Income from equity affiliates and other income 8,552 11,476 8,692 11,319 9,335
Total Revenues and Other Income 138,477 211,970 228,848 241,909 253,706
Total Costs and Other Deductions 133,635 180,768 192,943 195,577 206,072
Income Before Income Tax Expense 4,842 31,202 35,905 46,332 47,634
Income Tax Expense 132 11,892 14,308 19,996 20,626
Net Income 4,710 19,310 21,597 26,336 27,008
Less: Net income attributable to noncontrolling interests 123 69 174 157 113
Net Income Attributable to Chevron Corporation $ 4,587 $ 19,241 $ 21,423 $ 26,179 $ 26,895
Per Share of Common Stock
Net Income Attributable to Chevron
– Basic $ 2.46 $ 10.21 $ 11.18 $ 13.42 $ 13.54
– Diluted $ 2.45 $ 10.14 $ 11.09 $ 13.32 $ 13.44
Cash Dividends Per Share $ 4.28 $ 4.21 $ 3.90 $ 3.51 $ 3.09
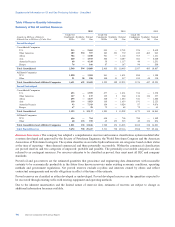
Balance Sheet Data (at December 31)
Current assets $ 35,347 $ 42,232 $ 50,250 $ 55,720 $ 53,234
Noncurrent assets 230,756 223,794 203,503 177,262 156,240
Total Assets 266,103 266,026 253,753 232,982 209,474
Short-term debt 4,928 3,790 374 127 340
Other current liabilities 21,536 28,136 32,644 34,085 33,260
Long-term debt and capital lease obligations 33,664 24,028 20,057 12,065 9,812
Other noncurrent liabilities 52,089 53,881 50,251 48,873 43,881
Total Liabilities 112,217 109,835 103,326 95,150 87,293
Total Chevron Corporation Stockholders’ Equity $ 152,716 $ 155,028 $ 149,113 $ 136,524 $ 121,382
Noncontrolling interests 1,170 1,163 1,314 1,308 799
Total Equity $ 153,886 $ 156,191 $ 150,427 $ 137,832 $ 122,181
*Includes excise, value-added and similar taxes: $ 7,359 $ 8,186 $ 8,492 $ 8,010 $ 8,085
68 Chevron Corporation 2015 Annual Report