Chevron 2015 Annual Report Download - page 7
Download and view the complete annual report
Please find page 7 of the 2015 Chevron annual report below. You can navigate through the pages in the report by either clicking on the pages listed below, or by using the keyword search tool below to find specific information within the annual report.-
 1
1 -
 2
2 -
 3
3 -
 4
4 -
 5
5 -
 6
6 -
 7
7 -
 8
8 -
 9
9 -
 10
10 -
 11
11 -
 12
12 -
 13
13 -
 14
14 -
 15
15 -
 16
16 -
 17
17 -
 18
18 -
19
-
20
-
21
-
22
-
23
-
24
-
25
-
26
-
27
-
28
-
29
-
30
-
31
-
32
-
33
-
34
-
35
-
36
-
37
-
38
-
39
-
40
-
41
-
42
-
43
-
44
-
45
-
46
-
47
-
48
-
49
-
50
-
51
-
52
-
53
-
54
-
55
-
56
-
57
-
58
-
59
-
60
-
61
-
62
-
63
-
64
-
65
-
66
-
67
-
68
-
69
-
70
-
71
-
72
-
73
-
74
-
75
-
76
-
77
-
78
-
79
-
80
-
81
-
82
-
83
-
84
-
85
-
86
-
87
-
88
 |
 |

Chevron Corporation 2015 Annual Report
5
chevron operating highlights1
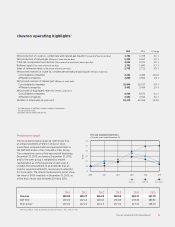
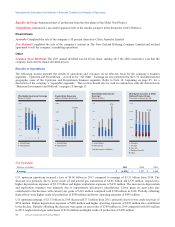
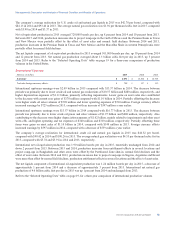
Performance graph
The stock performance graph at right shows how
an initial investment of $100 in Chevron stock
would have compared with an equal investment in
the S&P 500 Index or the Competitor Peer Group.
The comparison covers a five-year period begin ning
December 31, 2010, and ending December 31, 2015,
and for the peer group is weighted by market
capitalization as of the beginning of each year. It
includes the reinvestment of all dividends that an
investor would be entitled to receive and is adjusted
for stock splits. The interim measurement points show
the value of $100 invested on December 31, 2010, as
of the end of each year between 2011 and 2015.
*Peer Group: BP p.l.c.-ADS, ExxonMobil, Royal Dutch Shell p.l.c.-ADS, Total S.A.-ADS
Five-year cumulative total returns
(Calendar years ended December 31)
Chevron
S&P 500
Peer group*
2010 2011 2012 2013 2014 2015
Dollars
Chevron S&P 500 Peer group*
200
160
140
120
80
180
100
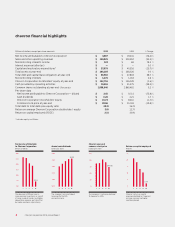
Change
Net production of crude oil, condensate and natural gas liquids (Thousands of barrels per day)
Net production of natural gas (Millions of cubic feet per day)
Total net oil-equivalent production (Thousands of oil-equivalent barrels per day)
Refinery input (Thousands of barrels per day)
Sales of refined products (Thousands of barrels per day)
Net proved reserves of crude oil, condensate and natural gas liquids2 (Millions of barrels)
Consolidated companies ()
Aliated companies
Net proved reserves of natural gas2 (Billions of cubic feet)
Consolidated companies
Aliated companies
Net proved oil-equivalent reserves2 (Millions of barrels)
Consolidated companies
Aliated companies
Number of employees at year-end3 ()
1 Includes equity in aliates, except number of employees
2 At the end of the year
3 Excludes service station personnel
Chevron Corporation 2015 Annual Report 5