Chevron 2015 Annual Report Download - page 72
Download and view the complete annual report
Please find page 72 of the 2015 Chevron annual report below. You can navigate through the pages in the report by either clicking on the pages listed below, or by using the keyword search tool below to find specific information within the annual report.-
 1
1 -
2
-
3
-
4
-
5
-
6
-
7
-
8
-
9
-
10
-
11
-
12
-
13
-
14
-
15
-
16
-
17
-
18
-
19
-
20
-
21
-
22
-
23
-
24
-
25
-
26
-
27
-
28
-
29
-
30
-
31
-
32
-
33
-
34
-
35
-
36
-
37
-
38
-
39
-
40
-
41
-
42
-
43
-
44
-
45
-
46
-
47
-
48
-
49
-
50
-
51
-
52
-
53
-
54
-
55
-
56
-
57
-
58
-
59
-
60
-
61
-
 62
62 -
 63
63 -
 64
64 -
 65
65 -
 66
66 -
 67
67 -
 68
68 -
 69
69 -
 70
70 -
 71
71 -
 72
72 -
 73
73 -
 74
74 -
 75
75 -
 76
76 -
 77
77 -
 78
78 -
 79
79 -
 80
80 -
 81
81 -
 82
82 -
83
-
84
-
85
-
86
-
87
-
88
 |
 |

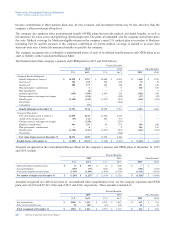
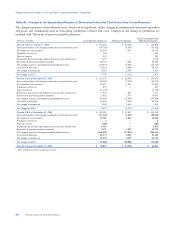
Supplemental Information on Oil and Gas Producing Activities - Unaudited
In accordance with FASB and SEC disclosure requirements for oil and gas producing activities, this section provides
supplemental information on oil and gas exploration and producing activities of the company in seven separate tables.
Tables I through IV provide historical cost information pertaining to costs incurred in exploration, property acquisitions and
development; capitalized costs; and results of operations. Tables V through VII present information on the company’s
estimated net proved reserve quantities, standardized measure of estimated discounted future net cash flows related to proved
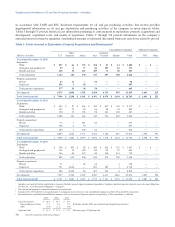
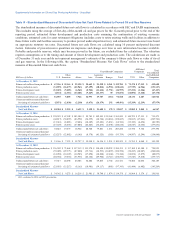
Table I - Costs Incurred in Exploration, Property Acquisitions and Development1
Consolidated Companies Affiliated Companies
Millions of dollars U.S.
Other
Americas Africa Asia
Australia/
Oceania Europe Total TCO Other
Year Ended December 31, 2015
Exploration
Wells $ 857$ 66$ 172$ 218$ 81$ 14$ 1,408 $ —$ —
Geological and geophysical 69 6 77 86 107 26 371 — —
Rentals and other 218 56 121 109 71 68 643 — —
Total exploration 1,144 128 370 413 259 108 2,422 — —
Property acquisitions2
Proved 23 21 — 54 — — 98 ——
Unproved 554 330———587 ——
Total property acquisitions 577 24 30 54 — — 685 — —
Development36,275 2,048 3,701 3,924 6,715 995 23,658 1,641 225
Total Costs Incurred4$ 7,996 $ 2,200 $ 4,101 $ 4,391 $ 6,974 $ 1,103 $ 26,765 $ 1,641 $ 225
Year Ended December 31, 2014
Exploration
Wells $ 965 $ 87 $ 436 $ 381 $ 207 $ 101 $ 2,177 $ — $ —
Geological and geophysical 107 72 32 64 88 41 404 — —
Rentals and other 150 37 198 98 101 103 687 — —
Total exploration 1,222 196 666 543 396 245 3,268 — —
Property acquisitions2
Proved 33 1 521 60 — — 615 — —
Unproved 196 2 39 — — — 237 — —
Total property acquisitions 229 3 560 60 — — 852 — —
Development38,207 3,226 3,771 4,363 7,182 887 27,636 1,598 393
Total Costs Incurred4$ 9,658 $ 3,425 $ 4,997 $ 4,966 $ 7,578 $ 1,132 $ 31,756 $ 1,598 $ 393
Year Ended December 31, 2013
Exploration
Wells $ 594 $ 495 $ 88 $ 405 $ 262 $ 123 $ 1,967 $ — $ —
Geological and geophysical 134 70 105 116 29 55 509 — —
Rentals and other 166 62 147 80 124 131 710 — —
Total exploration 894 627 340 601 415 309 3,186 — —
Property acquisitions2
Proved 71 — 26 64 — 1 162 — —
Unproved 331 2,068 — 203 105 3 2,710 — —
Total property acquisitions 402 2,068 26 267 105 4 2,872 — —
Development37,457 2,306 3,549 4,907 6,611 1,046 25,876 1,027 544
Total Costs Incurred4$ 8,753 $ 5,001 $ 3,915 $ 5,775 $ 7,131 $ 1,359 $ 31,934 $ 1,027 $ 544
1Includes costs incurred whether capitalized or expensed. Excludes general support equipment expenditures. Includes capitalized amounts related to asset retirement obligations.
See Note 25, “Asset Retirement Obligations,” on page 67.
2Does not include properties acquired in nonmonetary transactions.
3Includes $325, $349 and $661 costs incurred prior to assignment of proved reserves for consolidated companies in 2015, 2014, and 2013, respectively.
4Reconciliation of consolidated and affiliated companies total cost incurred to Upstream capital and exploratory (C&E) expenditures - $ billions:
2015 2014 2013
Total cost incurred $ 28.6 $ 33.7 $ 33.5
Non-oil and gas activities 3.5 4.6 5.8 (Primarily includes LNG, gas-to-liquids and transportation activities)
ARO (1.0) (1.2) (1.4)
Upstream C&E $ 31.1 $ 37.1 $ 37.9 Reference page 21 Upstream total
70 Chevron Corporation 2015 Annual Report