eBay 2003 Annual Report Download - page 35
Download and view the complete annual report
Please find page 35 of the 2003 eBay annual report below. You can navigate through the pages in the report by either clicking on the pages listed below, or by using the keyword search tool below to find specific information within the annual report.-
 1
1 -
2
-
3
-
4
-
5
-
6
-
7
-
8
-
9
-
10
-
11
-
12
-
13
-
14
-
15
-
16
-
17
-
18
-
19
-
20
-
21
-
22
-
23
-
24
-
 25
25 -
 26
26 -
 27
27 -
 28
28 -
 29
29 -
 30
30 -
 31
31 -
 32
32 -
 33
33 -
 34
34 -
 35
35 -
 36
36 -
 37
37 -
 38
38 -
 39
39 -
 40
40 -
 41
41 -
 42
42 -
 43
43 -
 44
44 -
 45
45 -
46
-
47
-
48
-
49
-
50
-
51
-
52
-
53
-
54
-
55
-
56
-
57
-
58
-
59
-
60
-
61
-
62
-
63
-
64
-
65
-
66
-
67
-
68
-
69
-
70
-
71
-
72
-
73
-
74
-
75
-
76
-
77
-
78
-
79
-
80
-
81
-
82
-
83
-
84
-
85
-
86
-
87
-
88
-
89
-
90
-
91
-
92
-
93
-
94
-
95
-
96
-
97
-
98
-
99
-
100
-
101
-
102
-
103
-
104
-
105
-
106
-
107
-
108
-
109
-
110
-
111
-
112
-
113
-
114
-
115
-
116
-
117
-
118
-
119
-
120
-
121
-
122
-
123
-
124
-
125
-
126
-
127
-
128
-
129
 |
 |

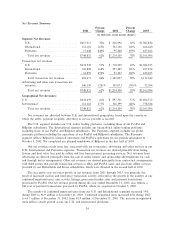
translation rate changes for the Euro, combined with translation rate changes in other foreign currencies,
resulted in increased net revenues of approximately $82.0 million in 2003 when compared to the weighted-
average foreign currency exchange rates used in the preparation of our consolidated Ñnancial statements in
2002. In addition, the weighted-average translation rate changes in foreign currencies increased operating
expenses by approximately $37.9 million in 2003 when compared to the weighted average translation rates
used in 2002.
We expect our international operations will continue to grow in signiÑcance as we develop and deploy
our global marketplace. As a result, foreign currency Öuctuations in future periods could become more
signiÑcant and may have a negative impact on our net revenues and net income. See the information in
Item 7A under ""Foreign Currency Risk'' for additional discussion of the impact of foreign currency
translation and related hedging activities.
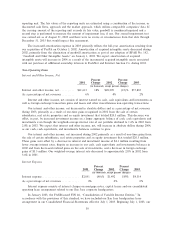
Liquidity and Capital Resources
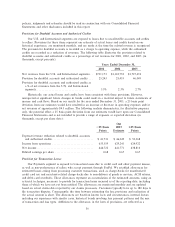
Cash Flows
Year Ended December 31,
2001 2002 2003
(in thousands)
Net cash provided by (used in):
Operating activities ÏÏÏÏÏÏÏÏÏÏÏÏÏÏÏÏÏÏÏÏÏÏÏÏÏÏ $ 252,112 $ 479,903 $ 874,119
Investing activities ÏÏÏÏÏÏÏÏÏÏÏÏÏÏÏÏÏÏÏÏÏÏÏÏÏÏÏ (29,819) (157,759) (1,319,542)
Financing activities ÏÏÏÏÏÏÏÏÏÏÏÏÏÏÏÏÏÏÏÏÏÏÏÏÏÏ 101,505 252,067 688,866
EÅect of exchange rates on cash and cash
equivalents ÏÏÏÏÏÏÏÏÏÏÏÏÏÏÏÏÏÏÏÏÏÏÏÏÏÏÏÏÏÏÏ (1,702) 11,133 28,757
Net increase in cash and cash equivalents ÏÏÏÏÏ $ 322,096 $ 585,344 $ 272,200
We have generated annual cash provided by operating activities in amounts greater than net income
in 2001, 2002 and 2003, driven mainly by non cash charges to earnings. Non-cash charges to earnings
included depreciation and amortization on our long-term assets, tax beneÑts on the exercise of employee
stock options resulting from our increasing stock price and the related increases in the personal gains
recognized by our employees, provision for doubtful accounts and authorized credits resulting from
increasing revenues, provision for transaction losses resulting from increased total payment volumes
processed by our PayPal subsidiary and other costs. In 2001, operating cash Öows were partially oÅset by
cash used to support working capital needs. In 2002 and 2003, operating cash Öows were positively
impacted by the net cash amounts provided by year-over-year changes in working capital assets and
liabilities. During 2003, we used net cash provided by operating and Ñnancing activities to fund purchases
of property and equipment, acquisitions and repayments of borrowings. Net cash provided by operating
activities also contributed to an increase in our aggregate cash, cash equivalents and investments balance
by $979.8 million in 2003 to approximately $2.8 billion. We currently expect that Ñscal 2004 cash Öows
from operations will continue to exceed net income. We believe that existing cash, cash equivalents and
investments, together with any cash generated from operations, will be suÇcient to fund our operating
activities, capital expenditures and other obligations for the foreseeable future. However, if during that
period or thereafter we are not successful in generating suÇcient cash Öows from operations or in raising
additional capital when required in suÇcient amounts and on terms acceptable to us, our business could
suÅer.
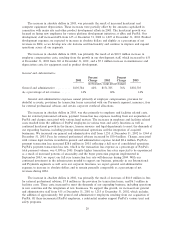
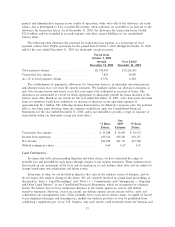
The net cash Öows used in investing activities in 2001, 2002 and 2003 were due primarily to the
movement of cash between cash and investments, the purchase of property and equipment, and
acquisitions. Purchases of property and equipment totaled $57.4 million in 2001, $138.7 million in 2002
and $365.4 million in 2003. Purchases of property and equipment in 2001 and 2002 related mainly to
purchases of computer equipment and software to support our site operations, customer support and
33