eBay 2003 Annual Report Download - page 110
Download and view the complete annual report
Please find page 110 of the 2003 eBay annual report below. You can navigate through the pages in the report by either clicking on the pages listed below, or by using the keyword search tool below to find specific information within the annual report.-
 1
1 -
2
-
3
-
4
-
5
-
6
-
7
-
8
-
9
-
10
-
11
-
12
-
13
-
14
-
15
-
16
-
17
-
18
-
19
-
20
-
21
-
22
-
23
-
24
-
25
-
26
-
27
-
28
-
29
-
30
-
31
-
32
-
33
-
34
-
35
-
36
-
37
-
38
-
39
-
40
-
41
-
42
-
43
-
44
-
45
-
46
-
47
-
48
-
49
-
50
-
51
-
52
-
53
-
54
-
55
-
56
-
57
-
58
-
59
-
60
-
61
-
62
-
63
-
64
-
65
-
66
-
67
-
68
-
69
-
70
-
71
-
72
-
73
-
74
-
75
-
76
-
77
-
78
-
79
-
80
-
81
-
82
-
83
-
84
-
85
-
86
-
87
-
88
-
89
-
90
-
91
-
92
-
93
-
94
-
95
-
96
-
97
-
98
-
99
-
 100
100 -
 101
101 -
 102
102 -
 103
103 -
 104
104 -
 105
105 -
 106
106 -
 107
107 -
 108
108 -
 109
109 -
 110
110 -
 111
111 -
 112
112 -
 113
113 -
 114
114 -
 115
115 -
 116
116 -
 117
117 -
 118
118 -
 119
119 -
 120
120 -
121
-
122
-
123
-
124
-
125
-
126
-
127
-
128
-
129
 |
 |

eBay Inc.
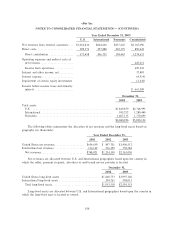
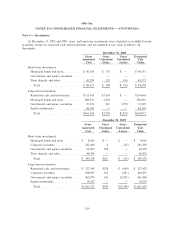
NOTES TO CONSOLIDATED FINANCIAL STATEMENTS Ì (CONTINUED)
Year Ended December 31, 2003
U.S. International Payments Consolidated
Net revenues from external customers ÏÏÏ $1,062,834 $664,640 $437,622 $2,165,096
Direct costs ÏÏÏÏÏÏÏÏÏÏÏÏÏÏÏÏÏÏÏÏÏÏÏÏÏ 389,376 257,888 243,179 890,443
Direct contribution ÏÏÏÏÏÏÏÏÏÏÏÏÏÏÏÏÏ 673,458 406,752 194,443 1,274,653
Operating expenses and indirect costs of
net revenues ÏÏÏÏÏÏÏÏÏÏÏÏÏÏÏÏÏÏÏÏÏÏÏ 645,412
Income from operations ÏÏÏÏÏÏÏÏÏÏÏÏÏ 629,241
Interest and other income, netÏÏÏÏÏÏÏÏÏÏ 37,803
Interest expense ÏÏÏÏÏÏÏÏÏÏÏÏÏÏÏÏÏÏÏÏÏÏ (4,314)
Impairment of certain equity investments (1,230)
Income before income taxes and minority
interest ÏÏÏÏÏÏÏÏÏÏÏÏÏÏÏÏÏÏÏÏÏÏÏÏÏÏÏ $ 661,500
December 31,
2002 2003
Total assets:
U.S. ÏÏÏÏÏÏÏÏÏÏÏÏÏÏÏÏÏÏÏÏÏÏÏÏÏÏÏÏÏÏÏÏÏÏÏÏÏÏÏÏÏÏÏÏÏÏÏÏÏÏÏÏÏÏÏÏÏ $1,849,859 $2,768,995
International ÏÏÏÏÏÏÏÏÏÏÏÏÏÏÏÏÏÏÏÏÏÏÏÏÏÏÏÏÏÏÏÏÏÏÏÏÏÏÏÏÏÏÏÏÏÏÏÏÏÏ 583,252 1,280,440
Payments ÏÏÏÏÏÏÏÏÏÏÏÏÏÏÏÏÏÏÏÏÏÏÏÏÏÏÏÏÏÏÏÏÏÏÏÏÏÏÏÏÏÏÏÏÏÏÏÏÏÏÏÏÏ 1,607,115 1,770,699
$4,040,226 $5,820,134
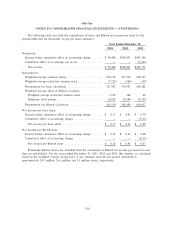
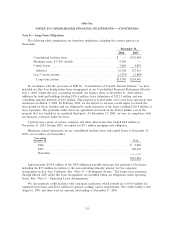
The following tables summarizes the allocation of net revenues and the long-lived assets based on
geography (in thousands):
Year Ended December 31,
2001 2002 2003
United States net revenues ÏÏÏÏÏÏÏÏÏÏÏÏÏÏÏÏÏÏÏÏ $634,659 $ 897,701 $1,406,512
International net revenues ÏÏÏÏÏÏÏÏÏÏÏÏÏÏÏÏÏÏÏÏÏ 114,162 316,399 758,584
Net revenuesÏÏÏÏÏÏÏÏÏÏÏÏÏÏÏÏÏÏÏÏÏÏÏÏÏÏÏÏÏÏ $748,821 $1,214,100 $2,165,096
Net revenues are allocated between U.S. and International geographies based upon the country in
which the seller, payment recipient, advertiser or end-to-end service provider is located.
December 31,
2002 2003
United States long-lived assets ÏÏÏÏÏÏÏÏÏÏÏÏÏÏÏÏÏÏÏÏÏÏÏÏÏÏÏ $1,648,753 $1,997,140
International long-lived assets ÏÏÏÏÏÏÏÏÏÏÏÏÏÏÏÏÏÏÏÏÏÏÏÏÏÏÏÏ 304,765 598,013
Total long-lived assetsÏÏÏÏÏÏÏÏÏÏÏÏÏÏÏÏÏÏÏÏÏÏÏÏÏÏÏÏÏÏÏÏÏ $1,953,518 $2,595,153
Long-lived assets are allocated between U.S. and International geographies based upon the country in
which the long-lived asset is located or owned.
108