eBay 2003 Annual Report Download - page 22
Download and view the complete annual report
Please find page 22 of the 2003 eBay annual report below. You can navigate through the pages in the report by either clicking on the pages listed below, or by using the keyword search tool below to find specific information within the annual report.-
 1
1 -
2
-
3
-
4
-
5
-
6
-
7
-
8
-
9
-
10
-
11
-
 12
12 -
 13
13 -
 14
14 -
 15
15 -
 16
16 -
 17
17 -
 18
18 -
 19
19 -
 20
20 -
 21
21 -
 22
22 -
 23
23 -
 24
24 -
 25
25 -
 26
26 -
 27
27 -
 28
28 -
 29
29 -
 30
30 -
 31
31 -
 32
32 -
33
-
34
-
35
-
36
-
37
-
38
-
39
-
40
-
41
-
42
-
43
-
44
-
45
-
46
-
47
-
48
-
49
-
50
-
51
-
52
-
53
-
54
-
55
-
56
-
57
-
58
-
59
-
60
-
61
-
62
-
63
-
64
-
65
-
66
-
67
-
68
-
69
-
70
-
71
-
72
-
73
-
74
-
75
-
76
-
77
-
78
-
79
-
80
-
81
-
82
-
83
-
84
-
85
-
86
-
87
-
88
-
89
-
90
-
91
-
92
-
93
-
94
-
95
-
96
-
97
-
98
-
99
-
100
-
101
-
102
-
103
-
104
-
105
-
106
-
107
-
108
-
109
-
110
-
111
-
112
-
113
-
114
-
115
-
116
-
117
-
118
-
119
-
120
-
121
-
122
-
123
-
124
-
125
-
126
-
127
-
128
-
129
 |
 |

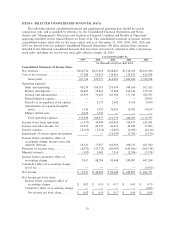
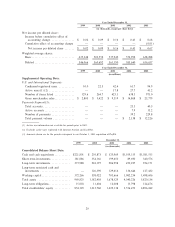
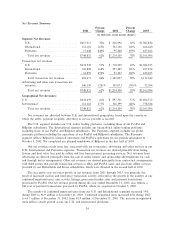
Year Ended December 31,
1999 2000 2001 2002 2003
(in thousands, except per share data)
Net income per diluted share:
Income before cumulative eÅect of
accounting changeÏÏÏÏÏÏÏÏÏÏÏÏÏÏÏÏÏ $ 0.02 $ 0.09 $ 0.16 $ 0.43 $ 0.68
Cumulative eÅect of accounting change Ì Ì Ì Ì (0.01)
Net income per diluted share ÏÏÏÏÏÏÏ $ 0.02 $ 0.09 $ 0.16 $ 0.43 $ 0.67
Weighted average shares:
BasicÏÏÏÏÏÏÏÏÏÏÏÏÏÏÏÏÏÏÏÏÏÏÏÏÏÏÏÏÏÏ 435,348 503,552 537,942 574,992 638,288
Diluted ÏÏÏÏÏÏÏÏÏÏÏÏÏÏÏÏÏÏÏÏÏÏÏÏÏÏÏÏ 546,066 560,692 561,190 585,640 656,657
Year Ended December 31,
1999 2000 2001 2002 2003
(in millions)
Supplemental Operating Data:
U.S. and International Segments:
ConÑrmed registered usersÏÏÏÏÏÏÏÏÏÏÏÏ 10.0 22.5 42.4 61.7 94.9
Active users(1)(2) ÏÏÏÏÏÏÏÏÏÏÏÏÏÏÏÏÏÏ Ì Ì 17.8 27.7 41.2
Number of items listed ÏÏÏÏÏÏÏÏÏÏÏÏÏÏ 129.6 264.7 423.1 638.3 971.0
Gross merchandise salesÏÏÏÏÏÏÏÏÏÏÏÏÏÏ $ 2,805 $ 5,422 $ 9,319 $ 14,868 $ 23,779
Payments Segment(3):
Total accounts ÏÏÏÏÏÏÏÏÏÏÏÏÏÏÏÏÏÏÏÏÏÏ Ì Ì Ì 23.3 40.3
Active accounts ÏÏÏÏÏÏÏÏÏÏÏÏÏÏÏÏÏÏÏÏÏ Ì Ì Ì 7.9 13.2
Number of payments ÏÏÏÏÏÏÏÏÏÏÏÏÏÏÏÏ Ì Ì Ì 39.2 229.8
Total payment volume ÏÏÏÏÏÏÏÏÏÏÏÏÏÏÏ Ì Ì Ì $ 2,138 $ 12,226
(1) Active user information not available for periods prior to 2001.
(2) Excludes active users registered with Internet Auction and EachNet.
(3) Amounts shown are for the periods subsequent to our October 3, 2002 acquisition of PayPal.
December 31,
1999 2000 2001 2002 2003
(in thousands)
Consolidated Balance Sheet Data:
Cash and cash equivalents ÏÏÏÏÏÏÏÏÏÏÏ $221,801 $ 201,873 $ 523,969 $1,109,313 $1,381,513
Short-term investments ÏÏÏÏÏÏÏÏÏÏÏÏÏ 181,086 354,166 199,450 89,690 340,576
Long-term investmentsÏÏÏÏÏÏÏÏÏÏÏÏÏÏ 373,988 218,197 286,998 470,227 934,171
Long-term restricted cash and
investments ÏÏÏÏÏÏÏÏÏÏÏÏÏÏÏÏÏÏÏÏÏ Ì 126,390 129,614 134,644 127,432
Working capitalÏÏÏÏÏÏÏÏÏÏÏÏÏÏÏÏÏÏÏÏ 372,266 538,022 703,666 1,082,234 1,498,606
Total assets ÏÏÏÏÏÏÏÏÏÏÏÏÏÏÏÏÏÏÏÏÏÏÏ 969,825 1,182,403 1,678,529 4,040,226 5,820,134
Long-term obligationsÏÏÏÏÏÏÏÏÏÏÏÏÏÏÏ 15,018 11,404 12,008 13,798 124,476
Total stockholders' equity ÏÏÏÏÏÏÏÏÏÏÏ 854,129 1,013,760 1,429,138 3,556,473 4,896,242
20