eBay 2002 Annual Report Download - page 30
Download and view the complete annual report
Please find page 30 of the 2002 eBay annual report below. You can navigate through the pages in the report by either clicking on the pages listed below, or by using the keyword search tool below to find specific information within the annual report.-
 1
1 -
2
-
3
-
4
-
5
-
6
-
7
-
8
-
9
-
10
-
11
-
12
-
13
-
14
-
15
-
16
-
17
-
18
-
19
-
 20
20 -
 21
21 -
 22
22 -
 23
23 -
 24
24 -
 25
25 -
 26
26 -
 27
27 -
 28
28 -
 29
29 -
 30
30 -
 31
31 -
 32
32 -
 33
33 -
 34
34 -
 35
35 -
 36
36 -
 37
37 -
 38
38 -
 39
39 -
 40
40 -
41
-
42
-
43
-
44
-
45
-
46
-
47
-
48
-
49
-
50
-
51
-
52
-
53
-
54
-
55
-
56
-
57
-
58
-
59
-
60
-
61
-
62
-
63
-
64
-
65
-
66
-
67
-
68
-
69
-
70
-
71
-
72
-
73
-
74
-
75
-
76
-
77
-
78
-
79
-
80
-
81
-
82
-
83
-
84
-
85
-
86
-
87
-
88
-
89
-
90
-
91
-
92
-
93
-
94
-
95
-
96
-
97
-
98
-
99
-
100
-
101
-
102
-
103
-
104
-
105
-
106
-
107
-
108
-
109
-
110
-
111
-
112
-
113
-
114
-
115
-
116
-
117
-
118
-
119
-
120
-
121
-
122
-
123
-
124
-
125
-
126
-
127
-
128
-
129
-
130
-
131
-
132
-
133
-
134
-
135
-
136
-
137
-
138
-
139
-
140
-
141
-
142
-
143
-
144
-
145
 |
 |

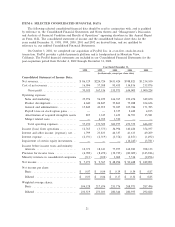
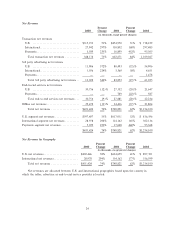
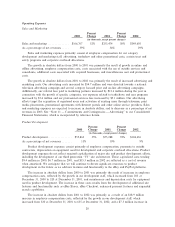
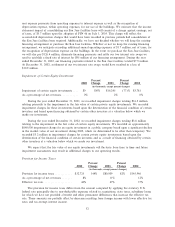
Operating Expenses
Sales and Marketing
Percent Percent
2000 Change 2001 Change 2002
(in thousands, except percent changes)
Sales and marketing ÏÏÏÏÏÏÏÏÏÏÏÏÏÏÏ $166,767 52% $253,474 38% $349,650
As a percentage of net revenues ÏÏÏÏÏ 39% 34% 29%
Sales and marketing expenses primarily consist of employee compensation for our category
development and marketing staÅ, advertising, tradeshow and other promotional costs, certain trust and
safety programs and corporate overhead allocations.
The growth in absolute dollars from 2000 to 2001 was primarily the result of growth in online and
oÉine advertising, employee compensation costs, costs associated with the use of outside services and
consultants, additional costs associated with acquired businesses, and miscellaneous user and promotional
costs.
The growth in absolute dollars from 2001 to 2002 was primarily the result of increased advertising and
marketing costs. Our advertising costs increased by $54.7 million and were directed towards a national
television advertising campaign and several category focused print and on-line advertising campaigns.
Additionally, our referral fees paid to marketing partners increased by $12.6 million during the year in
connection with the growth of speciÑc categories, our expenses related to tradeshows and user programs
increased by $5.4 million and our professional services fees increased by $5.1 million. Our advertising
eÅorts target the acquisition of registered users and activation of existing users through television, print
media placements, promotional agreements with Internet portals and other online service providers. Sales
and marketing expenses are expected to increase in absolute dollars, and to decrease as a percentage of net
revenues in 2003. See ""Note 11 Ì Commitments and Contingencies Ì Advertising'' to our Consolidated
Financial Statements, which is incorporated by reference herein.
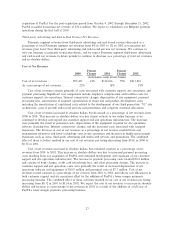
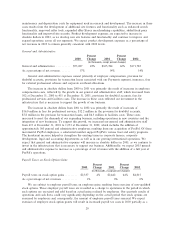
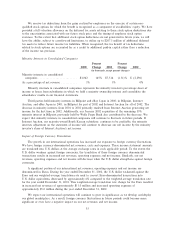
Product Development
Percent Percent
2000 Change 2001 Change 2002
(in thousands, except percent changes)
Product developmentÏÏÏÏÏÏÏÏÏÏÏÏÏÏÏÏÏ $55,863 35% $75,288 39% $104,636
As a percentage of net revenues ÏÏÏÏÏÏÏ 13% 10% 9%
Product development expenses consist primarily of employee compensation, payments to outside
contractors, depreciation on equipment used for development and corporate overhead allocations. Product
development expenses do not reÖect required capitalization of major site and product development eÅorts,
including the development of our third generation ""V3'' site architecture. These capitalized costs totaling
$9.4 million in 2000, $6.7 million in 2001, and $15.5 million in 2002 are reÖected as a cost of revenue
when amortized. We anticipate that we will continue to devote signiÑcant resources to product
development in the future as we add new features and functionality to the eBay and PayPal platforms.
The increase in absolute dollars from 2000 to 2001 was primarily the result of increases in employee
compensation costs, reÖected by the growth in our development staÅ, which increased from 203 at
December 31, 2000 to 320 at December 31, 2001, and maintenance and depreciation costs for equipment
used in product development. The increase in these costs results from the development of additional site
features and functionality such as eBay Stores, eBay Checkout, enhanced payment features and expanded
search capabilities.
The increase in absolute dollars from 2001 to 2002 was primarily as a result of an $18.9 million
increase in employee compensation costs, reÖected by the growth in our development staÅ, which
increased from 320 at December 31, 2001 to 635 at December 31, 2002, and a $7.3 million increase in
28