eBay 2002 Annual Report Download - page 28
Download and view the complete annual report
Please find page 28 of the 2002 eBay annual report below. You can navigate through the pages in the report by either clicking on the pages listed below, or by using the keyword search tool below to find specific information within the annual report.-
 1
1 -
2
-
3
-
4
-
5
-
6
-
7
-
8
-
9
-
10
-
11
-
12
-
13
-
14
-
15
-
16
-
17
-
 18
18 -
 19
19 -
 20
20 -
 21
21 -
 22
22 -
 23
23 -
 24
24 -
 25
25 -
 26
26 -
 27
27 -
 28
28 -
 29
29 -
 30
30 -
 31
31 -
 32
32 -
 33
33 -
 34
34 -
 35
35 -
 36
36 -
 37
37 -
 38
38 -
39
-
40
-
41
-
42
-
43
-
44
-
45
-
46
-
47
-
48
-
49
-
50
-
51
-
52
-
53
-
54
-
55
-
56
-
57
-
58
-
59
-
60
-
61
-
62
-
63
-
64
-
65
-
66
-
67
-
68
-
69
-
70
-
71
-
72
-
73
-
74
-
75
-
76
-
77
-
78
-
79
-
80
-
81
-
82
-
83
-
84
-
85
-
86
-
87
-
88
-
89
-
90
-
91
-
92
-
93
-
94
-
95
-
96
-
97
-
98
-
99
-
100
-
101
-
102
-
103
-
104
-
105
-
106
-
107
-
108
-
109
-
110
-
111
-
112
-
113
-
114
-
115
-
116
-
117
-
118
-
119
-
120
-
121
-
122
-
123
-
124
-
125
-
126
-
127
-
128
-
129
-
130
-
131
-
132
-
133
-
134
-
135
-
136
-
137
-
138
-
139
-
140
-
141
-
142
-
143
-
144
-
145
 |
 |
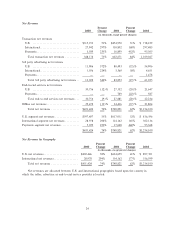
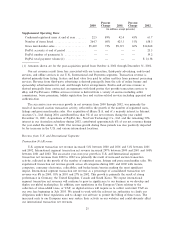
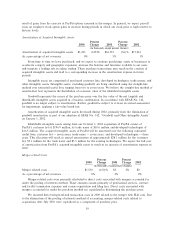
Third-party Advertising Net Revenue
U.S. third-party advertising net revenue increased as a percentage of total U.S. segment net revenues
from 3% in 2000 to 13% in 2001. The increase during 2001 was primarily the result of our strategy to
increase overall site monetization and the eÅorts of AOL Time Warner, Inc. or AOL, our exclusive
advertising sales representative. During the year ended December 31, 2002, U.S. segment third-party
advertising decreased in both absolute dollars, from $80.5 million in 2001 to $54.9 million in 2002, and as
a percentage of total U.S. segment net revenues, from 13% in 2001 to 7% in 2002. Revenues from
U.S. segment third-party advertising decreased during 2002 primarily as a result of a general deterioration
in the online advertising market that adversely impacted our advertising sales through AOL. International
segment third-party advertising net revenue decreased as a percentage of total International net revenues
from 4% to 3% to 2% in 2000, 2001 and 2002, respectively. Although the absolute dollar amount of
International segment third-party advertising net revenues increased during each of these periods, the
decreases in International segment third-party advertising as a percentage of total International segment
net revenues were primarily the result of transaction net revenues growing faster than advertising net
revenues. We continue to view our business as primarily transaction driven and we expect third-party
advertising net revenues in future periods to continue to decrease as a percentage of total net revenues and
in absolute dollars. Additionally, our advertising sales representative agreement with AOL has not been
extended or renewed and is scheduled to terminate on March 31, 2003, with AOL to continue its
electronic delivery of our online advertisements for a speciÑed wind-down period. After March 31, 2003,
our third-party advertising revenues will be dependent on the eÅorts of our existing internal sales staÅ.
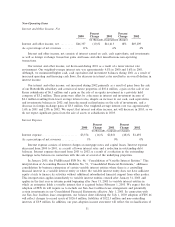
End-to-End Services Net Revenue
U.S. segment end-to-end services net revenue decreased successively in absolute dollars from
$30.8 million in 2000 to $27.1 million in 2001 to $21.6 million in 2002 and as a percentage of total
U.S. segment net revenues from 8% in 2000 to 4% in 2001 to 3% in 2002. As end-to-end services are
contractual and are largely dependent upon contractual terms and our users' adoption of third-party
products and services, we expect end-to-end services revenue in future periods to Öuctuate from period to
period, however, in general, we expect these revenues to decrease as a percentage of total net revenues and
in absolute dollars.
OÉine Net Revenue
OÉine net revenue decreased as a percentage of total U.S. segment net revenues from 9% to 5% to
2% in 2000, 2001 and 2002, respectively. During the year ended December 31, 2001, oÉine net revenue
decreased in both absolute dollars and as a percentage of total U.S. segment net revenues compared to
2000, primarily as a result of a general softening in the oÉine auction and high-end art markets. During
the year ended December 31, 2002, oÉine net revenue decreased in both absolute dollars and as a
percentage of total U.S. segment net revenues compared to 2001, primarily as a result of our divestiture of
both our ButterÑelds and Kruse subsidiaries. Accordingly, we do not expect to earn oÉine net revenue in
the foreseeable future.
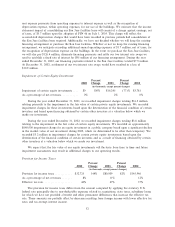
Net Revenues from Payments Segment
Net revenues from the Payments segment are generated from eBay's Billpoint operations for each of
the years presented and PayPal's operations for the post-acquisition period from October 4, 2002 through
December 31, 2002. See ""Note 3 Ì Business Combinations, Goodwill and Intangible Assets'' to the
consolidated notes to the Ñnancial statements for pro forma results of operations.
Transaction Net Revenue
Payments segment transaction net revenue increased 235% year-over-year between 2000 and 2001 and
452% between 2001 and 2002. The year-over-year growth in 2001 was the result of increased transaction
volume processed by eBay's Billpoint payment services. The growth in 2002 was primarily the result of our
26