Zynga 2013 Annual Report Download - page 98
Download and view the complete annual report
Please find page 98 of the 2013 Zynga annual report below. You can navigate through the pages in the report by either clicking on the pages listed below, or by using the keyword search tool below to find specific information within the annual report.-
 1
1 -
2
-
3
-
4
-
5
-
6
-
7
-
8
-
9
-
10
-
11
-
12
-
13
-
14
-
15
-
16
-
17
-
18
-
19
-
20
-
21
-
22
-
23
-
24
-
25
-
26
-
27
-
28
-
29
-
30
-
31
-
32
-
33
-
34
-
35
-
36
-
37
-
38
-
39
-
40
-
41
-
42
-
43
-
44
-
45
-
46
-
47
-
48
-
49
-
50
-
51
-
52
-
53
-
54
-
55
-
56
-
57
-
58
-
59
-
60
-
61
-
62
-
63
-
64
-
65
-
66
-
67
-
68
-
69
-
70
-
71
-
72
-
73
-
74
-
75
-
76
-
77
-
78
-
79
-
80
-
81
-
82
-
83
-
84
-
85
-
86
-
87
-
 88
88 -
 89
89 -
 90
90 -
 91
91 -
 92
92 -
 93
93 -
 94
94 -
 95
95 -
 96
96 -
 97
97 -
 98
98 -
 99
99 -
 100
100 -
 101
101 -
 102
102 -
 103
103 -
 104
104 -
 105
105 -
 106
106 -
 107
107 -
 108
108 -
109
-
110
-
111
-
112
-
113
-
114
-
115
-
116
-
117
-
118
-
119
-
120
-
121
-
122
-
123
-
124
-
125
-
126
-
127
-
128
-
129
 |
 |

Table of Contents
under our 2011 Plan will automatically increase on January 1 of each year, beginning on January 1, 2012, and continuing through and including
January 1, 2021, by 4% of the total number of shares of our capital stock outstanding as of December 31 of the preceding calendar year.
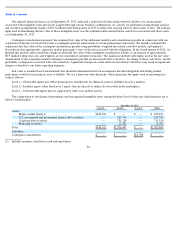
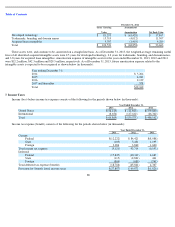
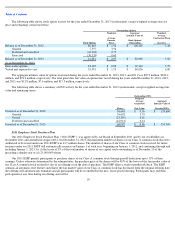
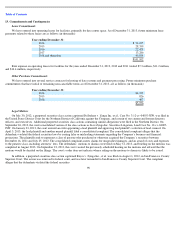
The following table presents the weighted-average grant date fair value of stock options and the related assumptions used to estimate the
fair value in our consolidated financial statements:
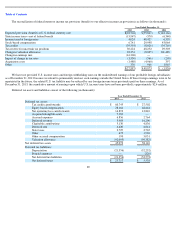
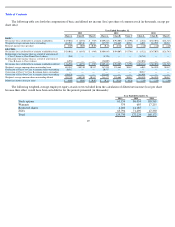
We recorded stock-based expense related to grants of employee and consultant stock options, warrants, restricted stock and ZSUs in our
consolidated statements of operations as follows (in thousands):
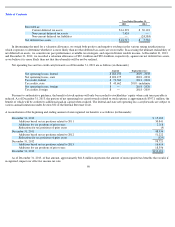
In the twelve months ended December 31, 2013 and 2012 we recognized $54.7 million and $204.7 million of stock-based expense
associated with ZSUs, respectively. Unamortized stock-based compensation relating to ZSUs amounted to $222.6 million as of December 31,
2013 over a weighted-average recognition period of 2.77 years.
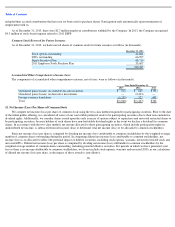
Shares granted in 2013 included 17.5 million performance-based ZSUs granted as part of our executive compensation plan with vesting
that was dependent on the achievement of certain 2013 annual performance metrics in addition to the passage of time. 10.7 million of these
grants were forfeited on or prior to December 31, 2013 due to executive departures prior to vesting and due to the degree of achievement of the
performance criteria. We recorded $3.0 million of stock-based expense related to this plan in the twelve months ended December 31, 2013.
Subsequent to December 31, 2013, our Board approved the final cash and equity payouts under this plan. Accordingly, 4.5 million shares
granted during 2013 will be reflected as forfeited during the first quarter of 2014.
In March 2012, we donated one million shares of Class A common stock to Zynga.org, an unaffiliated non-profit organization that was
formed in March 2012 to support charitable causes in the communities in which we conduct business. Zynga.org is a separate legal entity in
which we have no financial interest and do not exercise control and, accordingly, is not consolidated in our consolidated financial statements.
For our contribution of Class A common stock we recorded $13.1 million of stock-based expense, which is included in general and
administrative expenses, equal to the fair value of the shares of Class A common stock issued.
As of December 31, 2013, total unrecognized stock-
based expense of $27.6 million and $15.0 million related to unvested stock options and
restricted shares of common stock, respectively, is expected to be recognized over a weighted-average recognition period of approximately 3.42
and 2.03 years, respectively.
94
Year Ended December 31,
2013
2012
2011
Expected term, in years
7
6
6
Risk
-
free interest rates
2.05
0.67
%
2.04
%
Expected volatility
49
%
62
%
64
%
Dividend yield
—
—
—
Weighted
-
average estimated fair value of options granted during the year
$
1.82
$
1.58
$
4.17
Year Ended December 31,
2013
2012
2011
Cost of revenue
$
468
$
12,116
$
17,660
Research and development
61,931
200,640
374,920
Sales and marketing
8,079
24,684
81,326
General and administrative
13,915
44,546
126,306
Total stock
-
based expense
$
84,393
$
281,986
$
600,212